What tariffs may mean for the economy and portfolios

Kristy Akullian, CFA, Carolyn Barnette, CFA, CFP Nov 07, 2025 North America

KEY TAKEAWAYS

  • Tariff rates have risen sharply, but U.S. companies — and the U.S. economy — have proven more resilient than many investors feared.
  • Tariff pass-through takes time, and survey data suggests that U.S. companies may be poised to shift more of the burden to consumers. The full impact of tariffs remains to be seen.
  • Strong growth and greater pricing power makes us prefer U.S. equities, but we also see room for inflation protection and geographic diversification in the new trade regime.
DYNF

iSHARES U.S. EQUITY FACTOR ROTATION ACTIVE ETF

Seek growth potential through active rotation across U.S. equity factors.

IBIT

iSHARES BITCOIN TRUST ETF

Gain exposure to bitcoin with the liquidity of an ETP.

IAU

iSHARES GOLD TRUST

Seek convenient, cost-effective exposure to physical gold.

The iShares Trusts are not investment companies registered under the Investment Company Act of 1940, and therefore are not subject to the same regulatory requirements as mutual funds or ETFs registered under the Investment Company Act of 1940. Investments in these products are speculative and involve a high degree of risk.

Tariffs have dominated headlines — and market movements — for much of the year. While we believe peak policy uncertainty is almost certainly behind us, October brought potential new tariff announcements after China took actions relating to rare earths. Clearly, trade policy remains complex and will continue to evolve. Against this uncertain backdrop, we examine what impact tariffs had in the first six months since the Trump administration rolled out sweeping changes to trade policy, what remains to be seen, and what it may mean for portfolios.

THE FIRST 180 DAYS: HOW TARIFFS HAVE SHIFTED

The average effective tariff rate in the U.S. stands at 17%, up from just 2.4% at the start of the year.1 But the increase in tariff rates has not been uniform across goods, countries, or time. After announcing sharply higher tariff rates for much of the world in April, the U.S. administration put a 90-day pause on implementation.2 Since then, many deals have been struck that have established new rates, select exemptions, and in some instances delays in implementation. What's more, a spate of lawsuits challenging the legality of a subset of the tariffs continues to wind its way through the courts. While we have seen stabilization in trade policy since April, it’s clear the situation remains fluid.

Figure 1: Current tariff rates for select trading partners/industries, and when they came into effect

Bar chart of effective tariff rates on January 1 2025 and on October 1 2025 for various countries and sectors.

Source: Congressional Research Services and HBS Pricing Lab as of October 10, 2025.

Chart description: Bar chart of effective tariff rates on January 1 2025 and on October 1 2025 for various countries and sectors.


TARIFFS 2025: WHAT DO WE KNOW NOW?

Revenue — While it may still be early days for the tariffs, we have some evidence of their impact in terms of revenue generated for the government. The Daily Treasury Statement shows that since tariffs were announced in April, cumulative customs and excise tax revenue has run about $88 billion higher vs the same period in 2024.3 Additional revenue can be used to offset government spending elsewhere, a potential boon to federal finances. However, with the federal deficit running at nearly $2 trillion in 20254, we feel the impact is likely to be modest, absent further changes.
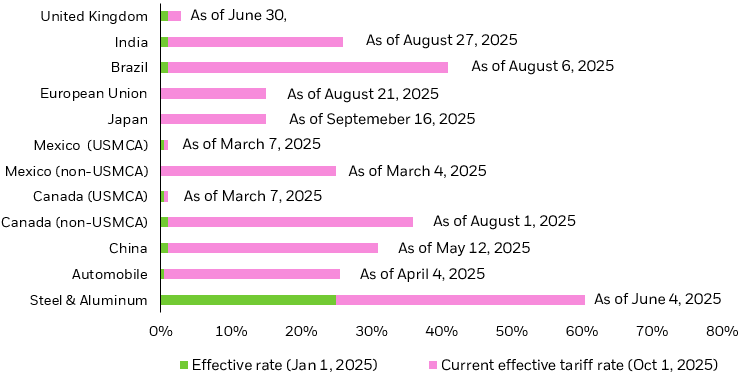
PaymentWho ultimately pays for tariffs? This remains the most important question for many investors. At the end of June, Goldman Sachs and BNP Paribas separately estimated that U.S. firms had absorbed around 60% of the total cost of tariffs, with foreign firms and U.S. consumers absorbing a further 20% each. But as the situation evolves, we believe those early estimates are likely to change (more below).

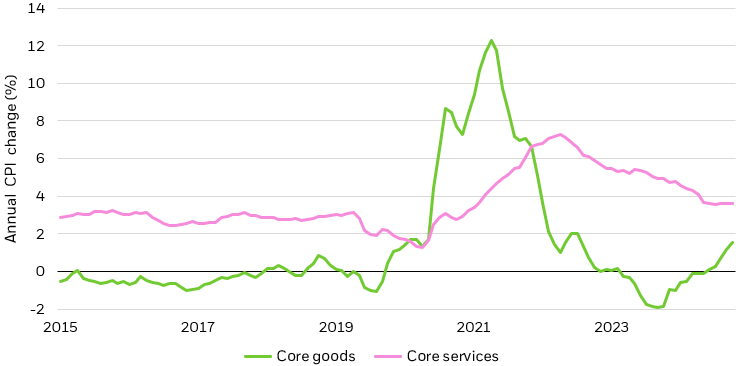
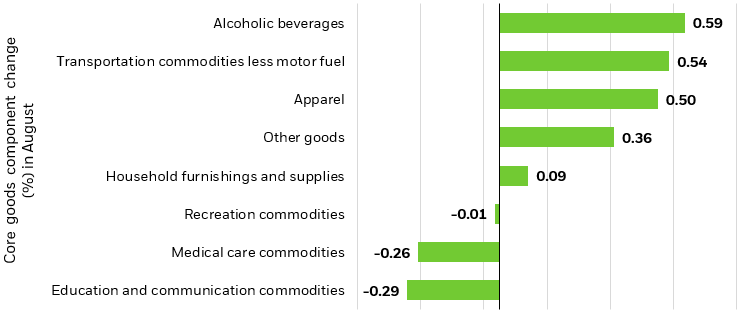
Inflation — While perhaps not as large or as fast as some market participants anticipated, we see some evidence of higher tariffs in inflation reports. Parts of the CPI basket that are highly exposed to supply chains in some of the highest-tariffed regions, such as apparel, furniture, and sporting goods, have seen prices rise in recent months. And there may be evidence of indirect effects as well. As we learned during the pandemic, consumers who are unable to spend on services may pivot to goods; we feel the same effect is likely happening to some extent in reverse, as consumers put off by higher tariffs have pivoted to services, with evidence of such substitution found in higher concert, dining, and lodging prices.5 Still, we have not seen future inflation expectations become unanchored, and the acceleration in inflation from the summer was not enough to prevent the Federal Reserve from resuming rate cuts in September and October.

Figure 2: Evidence of tariff pass-through in core goods

Source: BlackRock, Bloomberg, U.S. Bureau of Labor Statistics, core goods and core services as represented by CPI inflation. As of Sept. 15, 2025. Bottom chart represent MoM percentage change from July to August 2025.

Chart description: Line graph on the top showcases annual CPI change for core goods and core services from 2015 to 2025. Bar graph on the bottom demonstrates core goods component change in August of different sectors.


Line graph on the left hand side of annual CPI change for core goods and core services from 2015 to 2025.

Chart description: Line graph on the left hand side of annual CPI change for core goods and core services from 2015 to 2025. Bar graph on the right hand side of core goods component change in August of different sectors.


Growth — All told, U.S. companies — and indeed the U.S. economy — have proven remarkably more resilient than many investors expected. Second quarter earnings handily beat low expectations, delivering 12% year-over-year growth compared to the 4% forecasted by analysts.6 And while GDP growth was negative in Q1 as companies and individuals pulled forward import purchases ahead of expected tariffs, Q2 GDP figures surprised to the upside, only to be further revised higher.7 Though the full economic impact of the tariffs cannot yet be determined cannot be determined thus far (more below), we have avoided the worst-case scenarios some observers initially projected.

Figure 3: GDP rebounded after Q1’s decline

Contributions to U.S. GDP, quarter-over-quarter change

Bar graph of GDP quarter over quarter change from Q3 2024 to Q4 2025.

Source: Bloomberg, as of October 16, 2025. * Q3 and Q4 2025 data estimates according to Bloomberg. Past performance does not guarantee future results. Forward looking estimates may not come to pass.

Chart description: Bar graph of GDP quarter over quarter change from Q3 2024 to Q4 2025.


TARIFFS 2025 & BEYOND: WHAT ARE WE STILL WATCHING FOR?

Tariff pass-through is likely to take time. U.S. firms tend to keep a few weeks to several months’ worth of inventory on hand, though this varies by industry.8 That means that tariffs that went into effect in August may only show up in September or October accounting, which itself is often reported on a quarterly lag. Beyond delays due to inventory, we believe many companies may have held off passing higher input costs to consumers as uncertainty around trade policy and the economy remained high. But signs of a stronger consumer and economy evident in September’s economic data, and more certainty that tariffs are here to stay, may spur companies to shift more of the burden to their customers.

Earlier in the tariff cycle, U.S. businesses absorbed most of the costs. More recent estimates indicate that the balance is shifting, with consumers now expected to bear a majority of total tariff costs, around 55% as the effects of recent trade measures continue to filter through. Meanwhile, the share absorbed by businesses has declined to roughly 22% as firms pass on higher input costs.10 What’s more, tariff rates on China, India, computer chips, and semiconductors are still being negotiated. Tariffs on specific goods, such as those that recently went into effect on lumber and wood products in October, have yet to appear in the data. And new tariffs were still being announced. We expect the impact of tariffs to continue to evolve in the quarters, and perhaps years ahead.

WHAT DOES TRADE POLICY MEAN FOR PORTFOLIOS?

The stronger-than-expected economy, coupled with forward expectations for greater corporate pricing power, leave us comfortable with U.S. equity risk. But the impacts of tariffs have not been uniform, even within sectors. Third quarter earnings calls will be closely watched for mentions of tariffs and the impact on margins. We favor a systematic approach to seeking winners and losers in affected sectors.

Consider dynamic strategies in tax efficient ETF wrappers, which can be accessed via the iShares U.S. Equity Factor Rotation Active ETF (DYNF) and the iShares U.S. Thematic Rotation Active ETF (THRO).

Because strong pricing power and higher inflation are often two sides of the same coin, we also believe targeted inflation protection such as Treasury Inflation Protected Securities (TIPS) or gold deserves consideration.

Such inflation hedges may be accessed via the iShares 0-5 Year TIPS Bond ETF (STIP) and the iShares Gold Trust (IAU). For investors with higher risk tolerance, we believe the fixed supply of digital currencies such as Bitcoin may also help provide an effective inflation hedge. Exposure to other digital assets, such as the iShares Ethereum Trust ETF (ETHA), may offer additional diversification benefits.

The iShares Trusts are not investment companies registered under the Investment Company Act of 1940, and therefore are not subject to the same regulatory requirements as mutual funds or ETFs registered under the Investment Company Act of 1940. Investments in these products are speculative and involve a high degree of risk.

Finally, while we prefer the strong earnings growth and AI tailwind in U.S. large caps, it’s also important to note that broad geographic diversification has benefited many investors, even in a year fraught with geopolitical tensions. One global response to more uncertain U.S. trade policy has been lower demand for dollars, as evidenced by record annual purchases of gold by global central banks, and a 10% decline in the value of the USD.11 A cheaper dollar has propelled many international indexes to outperform domestic ones.12 Going forward, we anticipate the tailwind to continue and see international equities as a key source of diversification in an ever-evolving world.

Investors interested in adding international equity exposure to portfolios may consider the iShares Core MSCI Total International Stock ETF (IXUS).

FEATURED FUNDS

  • iShares ETFs are available to purchase through a brokerage account or with a financial advisor.

    Buy through your brokerage

    iShares funds are available through online brokerage firms. All iShares ETFs and ETPs trade commission free online through Fidelity.

    By clicking on the button below, you will leave BlackRock’s website.

    Buy now on Fidelity

    Contact your advisor

    Contact a financial professional to discuss how iShares ETFs and ETPs can fit in your investment portfolio.

    Carefully consider the Funds' investment objectives, risk factors, and charges and expenses before investing. This and other information can be found in the Funds' prospectuses or, if available, the summary prospectuses, which may be obtained by visiting the iShares ETF and BlackRock Fund prospectus pages. Read the prospectus carefully before investing. Investing involves risk, including possible loss of principal.

    Any links to third-party websites are provided for use at your own discretion. Each third party is solely responsible for the content presented and availability of its website. BlackRock does not control, monitor or maintain third-party websites, their content or the products/services they offer. Content may change without notice. When you leave BlackRock’s website and enter a third-party website, you will be subject to that site’s terms, policies and/or notices, including those related to privacy and security, as applicable. Please review those policies and notices on the third-party website.

    Before engaging Fidelity or any broker-dealer, you should evaluate the overall fees and charges of the firm as well as the services provided. Free commission offer applies to online purchases of select iShares ETFs in a Fidelity account. The sale of ETFs is subject to an activity assessment fee (from $0.01 to $0.03 per $1,000 of principal). For iShares ETFs, Fidelity receives compensation from the ETF sponsor and/or its affiliates in connection with an exclusive long-term marketing program that includes promotion of iShares ETFs and inclusion of iShares funds in certain Fidelity Brokerage Services platforms and investment programs. Please note, this security will not be marginable for 30 days from the settlement date, at which time it will automatically become eligible for margin collateral. Additional information about the sources, amounts, and terms of compensation can be found in the ETF’s prospectus and related documents. Fidelity may add or waive commissions on ETFs without prior notice.

    The Funds are distributed by BlackRock Investments, LLC (together with its affiliates, “BlackRock”).

    ©2024 BlackRock, Inc or its affiliates. All Rights Reserved. BLACKROCK, iSHARES, iBONDS, LIFEPATH, ALADDIN and the iShares Core Graphic are trademarks of BlackRock, Inc. or its affiliates. All other trademarks are those of their respective owners.

    iCRMH1124U/S-3985892

The iShares Trusts are not investment companies registered under the Investment Company Act of 1940, and therefore are not subject to the same regulatory requirements as mutual funds or ETFs registered under the Investment Company Act of 1940. Investments in these products are speculative and involve a high degree of risk.
Photo: Kristy Akullian, CFA

Kristy Akullian, CFA

Head of iShares Investment Strategy for the Americas

Photo: Carolyn Barnette, CFA, CFP

Carolyn Barnette, CFA, CFP

Head of Portfolio Insights for Wealth

Faye Witherall

Investment Strategist

Contributor

Annie Khanna

Investment Strategist

Contributor

Emily Fredrix Goodman

Editor

Contributor