Fed Outlook 2026: Rising Rates are Back. Is Your Bond Portfolio Ready?

Key takeaways

  • In September, the U.S. Federal Reserve increased interest rates by 0.25% to a range of 3.75% to 4.0%. The decision to raise rates was primarily based on reducing elevated levels of inflation to deliver price stability. However, the committee noted that economic activity is expanding at a solid pace. The forward path of rates has become less certain, with the current fed funds futures pricing at 4.2% by year end.
  • Long-term yields have also risen to almost 20-year highs.1 During the post-meeting press conference on September 16, Chairman Kevin Warsh noted that higher 10-year Treasury yields have been driven by economic strength, competition for capital and geopolitical factors.
  • Given this current backdrop, we see opportunities for investors to put extra cash to work, possibly allocating to floating rate exposures, managing interest rate risk with intermediate maturities, building bond ladders and seeking higher income outside of core bonds.
SGOV

iShares 0-3 Month Treasury Bond ETF

Pursue yield with the largest Treasury ETF in the market.2

GOVM

iShares 1-10 Year Treasury Bond ETF

Seek targeted exposure to intermediate-term government debt.

FLOT

iShares Floating Rate Bond ETF

Navigate interest rate risk while seeking income from corporate bonds.

BINC

iShares Flexible Income Active ETF

Get direct access to harder-to-reach fixed income sectors through active management.

What’s our outlook for Fed policy in 2026?

The outlook for Fed policy has shifted significantly in 2026. Market participants entered the year expecting rate cuts, then in March began pricing in multiple rate hikes by year end.3 In September, the Federal Reserve increased the fed funds target rate by 0.25% to a range of 3.75% to 4.00%. Our baseline scenario is for the Fed to hike one additional time in 2026 as the Fed seeks to reduce inflation at "sufficient speed". While the move is significant, we don’t believe this is the start of an aggressive hiking cycle. The Chairman has emphasized his intention to provide less forward guidance, but a demonstrated commitment to bringing inflation back towards target could help contain inflation expectations and support longer-term bonds. The committee noted that the forward path of rates has become less certain, with fed funds futures currently pricing in 4.20% by year-end.4

Beyond 2026, the outlook is more uncertain as:

  • The Fed is navigating a shifting geopolitical, technological and economic landscape as it aims to focus on its dual mandate of price stability and full employment. The economy remains resilient, but growth is becoming more uneven. Strong AI investment and consumer spending continue to support the economy, but higher interest rates may continue to weigh on more interest-rate-sensitive parts of the economy, including housing, small businesses, and lower-income consumers.
  • Inflation remains above the Fed’s 2% target, and the U.S. labor market strength has been concentrated in certain sectors, such as healthcare, education and hospitality.5
  • Fed Chair Kevin Warsh launched five new policy task forces, reflecting areas where Chair Warsh is considering the largest changes to existing Fed policy. In press conferences, Warsh reiterated his aversion to forward guidance several times, which we expect to translate to greater rate volatility.

For investors, we believe bonds offer a compelling opportunity set for income generation. Higher Treasury yields may reflect strong economic growth rather than purely inflation pressures. We continue to favor the front end and belly of the yield curve (intermediate maturities under 10 years), where investors can seek attractive income while maintaining flexibility. Floating rate bonds can enable investors to benefit from higher rates as their coupons are reset. Investors can seek income with corporate credit, securitized assets, and emerging market bonds.

What are fed funds futures signaling?

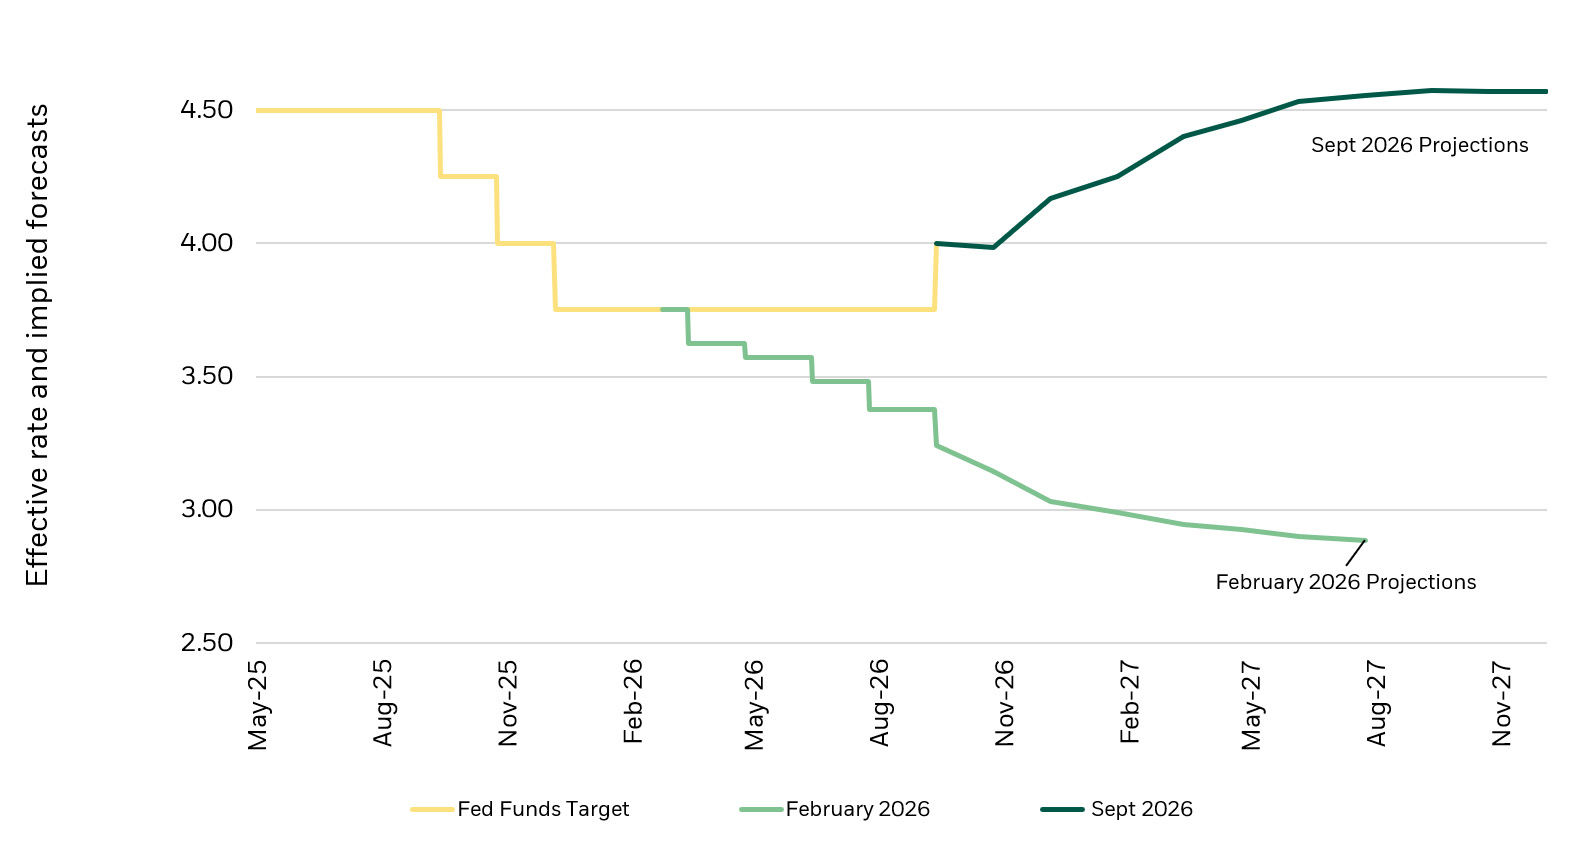
At the beginning of 2026, the market was pricing in rate cuts by the Fed but is currently pricing in one additional rate hike this year to bring the overnight rate to a range of 4.00% to 4.25%.6 The market is pricing in another one or two hikes in 2027 to bring the fed funds target rate to 4.25% to 4.5%, based on both the Fed's Summary of Economic Projections and their desire to restore price stability (lower inflation rates) to the economy.

About Face: Fed funds now pricing in a hike towards the end of 2026

chart showing fed funds rates and market expectations

Source: Bloomberg and ICAP using the daily fed funds effective rate and prices of fed funds futures contracts on 2/27/2026 and 9/16/2026.

Chart description: This chart compares market expectations for the Federal Reserve's policy rate at two points in time: February 27, 2026 and September 16, 2026. The yellow line shows the federal funds target rate over the period, while the green and dark green lines show the policy rate path implied by fed funds futures contracts as of the two dates. The February 2026 forecast anticipated a steady decline in the federal funds rate through 2027. By September 2026, market expectations had shifted significantly higher, with investors anticipating the Fed would maintain a more restrictive policy stance and keep interest rates elevated for longer.
The federal funds effective rate is the average interest rate at which banks lend reserve balances to one another overnight. The implied forecasts are derived from prices of fed funds futures contracts, which reflect market participants' expectations for the future path of the federal funds rate.
Forecasts are not guaranteed and may not come to pass.


How FOMC Policy May Change Under Kevin Warsh?

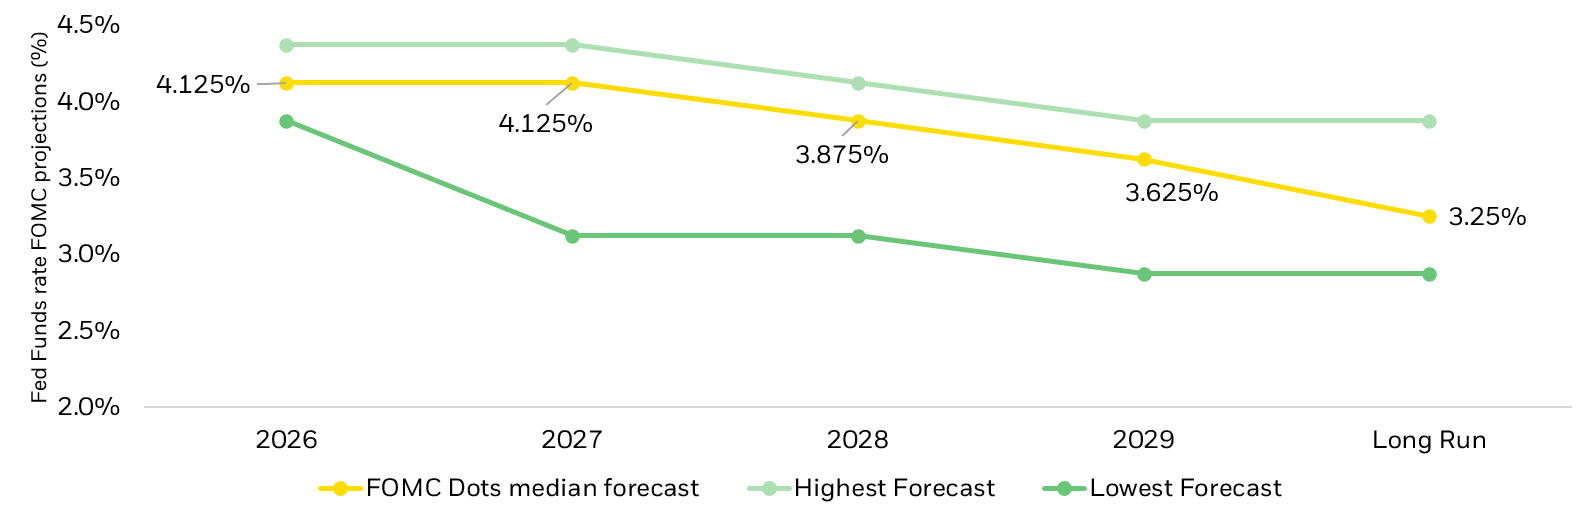
The Summary of Economy Projections, known as the Dot Plot, was first released in 2012 to improve transparency. However, Chairman Warsh did not submit an estimate for the June 2026 meeting, his first as Fed Chair, and he mentioned an aversion to forward guidance during the press conference.

The September 2026 Dot Plot demonstrated more officials seeking to keep rates elevated in the near term. According to the Fed’s latest projections, policymakers expect the fed funds rate to gradually decline toward a longer-run level of approximately 3.25%.7

Figure 2: Dot Plot reveals a wider distribution of future rate paths

dot plot showing expected short term interest rates

Source: US Federal Reserve as of 9/16/2026.

Chart description: Federal Reserve policymakers expect the federal funds rate to trend lower over the next several years, according to the September 2026 Summary of Economic Projections. The median forecast declines from just above 4% in 2026 to roughly 3.25% in the longer run, though projections vary across policymakers. Overall, the chart suggests rates may remain higher than many investors anticipated, even as the Fed moves toward gradually easing monetary policy.


What Are the Fed's Five New Task Forces?

In June 2026, Chairman Warsh announced the creation of five Task Forces: Communications, the Balance Sheet, Data Sources, Productivity and Jobs, and the Inflation Framework.

These task forces will gather data and make recommendations before the end of the year. The findings could provide policymakers with additional information as they evaluate future policy decisions. Investors should monitor future announcements for potential signals of how the central bank's approach may evolve.

What does the Fed balance sheet mean for interest rates?

Since the Global Financial Crisis, the Fed has increased its use of its balance sheet as a monetary policy tool, purchasing U.S. Treasury securities and agency mortgage-backed securities to help influence longer-term interest rates and broader financial conditions alongside changes to the federal funds rate.8

By buying bonds, the Fed aimed to lower long-term interest rates, making borrowing cheaper and stimulating economic activity. This process is known as quantitative easing.

Conversely, the Fed can reduce its balance sheet by selling bonds or allowing them to mature without reinvestment. This increases the amount of Treasury and mortgage-backed securities available to private investors, which can put upward pressure on longer-term interest rates and tighten overall financial conditions, a process known as quantitative tightening.

A new task force focused on the balance sheet will evaluate both the size and composition, while considering the need to provide the banking system with ample reserves. No new announcements were made at the June meeting aside from the task force creation. The Fed’s balance sheet is $6.7 trillion or 21% of nominal GDP – but has declined by $2.2 trillion since June 2022. 9

In contrast to the Fed, the U.S. Treasury Department increased the size of the U.S. Treasury buyback program. This program’s goal is to improve liquidity and stability in the U.S. Treasury bond market. In August 2026, the U.S. Treasury increased the size of its buyback operations for longer-maturity U.S. Treasuries.10 This program is expected to continue, providing support for the bond market.

Fixed income investing in 2026

Under this market backdrop, here are some ways investors can use bond ETFs to position their portfolios:

  • Put cash to work: If overnight interest rates stay higher for longer, investors could consider allocating to 0-3 month Treasuries or diversified short duration bonds. Investors interested in short-term bonds may consider the iShares 0-3 Month Treasury Bond ETF (SGOV).
  • Ride up rate hikes with floating rate: Floating rate bonds have coupons that reset at regular intervals with short-term rates. Investors considering floating rate bonds can select from U.S. Treasuries (TFLO), corporate bonds (FLOT), AAA CLOs (CLOA) and bank loans (USLN).
  • Reduce long-end exposure: With the Fed reducing forward guidance, there may be more interest rate volatility. Investors interested in reducing exposure to 10-plus-year bonds, which generally have the most interest rate risk, may consider the iShares 1-10 Year Treasury Bond ETF (GOVM) and iShares 1-10 Year U.S. Aggregate Bond ETF (AGGM).
  • Build bond ladders: Bond ladders hold an equal weight to each calendar year and can allow investors to seek consistent income despite changes in interest rates. iShares iBonds 1-5 Year Corporate Ladder (LDRC) offers exposure to a professionally managed corporate bond ladder.
  • Seek higher income: Boost fixed income returns with potentially higher yielding bonds, such as high yield, emerging markets, bank loans and collateralized loan obligations (CLOs). Investors interested in higher yielding bonds may consider the iShares Broad USD High Yield Corporate Bond ETF (USHY), the iShares J.P. Morgan USD Emerging Markets Bond ETF (EMB), the iShares Flexible Income Active ETF (BINC) and the iShares Securitized Income Active ETF (SECU).

Frequently asked questions

The Federal Reserve is expected to remain cautious as inflation remains above target and economic growth moderates. Markets have shifted from expecting rate cuts to pricing in the possibility of rate hikes this year.

Persistent inflation, a resilient labor market and changes in Federal Reserve leadership have increased uncertainty around future FOMC decisions.

Kevin Warsh is the new Federal Reserve Chairman. In his first policy meeting as Chairman, Warsh introduced five new policy review task forces that may influence future monetary policy and central bank communications.

Fed funds futures reflect market expectations for future Federal Reserve policy rates and provide insight into how investors expect interest rates to evolve.

Bond ETFs may help investors manage duration, seek income, maintain liquidity and diversify fixed income exposure during periods of changing monetary policy.

Featured funds

Photo of Karen Veraa-Perry, CFA

Karen Veraa-Perry, CFA

Head of U.S. iShares Fixed Income Strategy

Aaron Task

Content Specialist

Contributor

Jairo Garcia

Fixed Income Strategist

Contributor