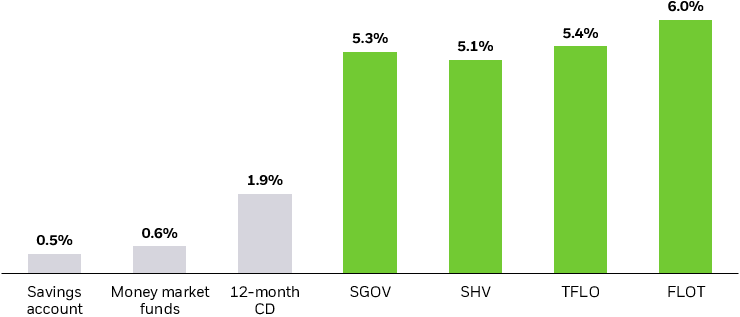
FINANCIAL PROFESSIONALS
OUTLOOK & INSIGHTS
BY TOPIC
DOCUMENTS
TAX RESOURCES
All types of investors are recognizing that bond ETFs can help modernize fixed income portfolios. Sophisticated institutions, financial professionals and do-it-yourself individual investors all can potentially benefit from competitive performance, low costs and deep liquidity.
Competitive performance
iShares and BlackRock bond ETFs have outperformed more than half of their peers over the past 10 years.1
Low cost
On average, iShares and BlackRock bond ETFs cost 72% less than active mutual funds.2
Liquidity
Bond ETFs trade thousands of times throughout the day on the exchange, while individual bonds may not trade daily.3
iShares ETFs offer comprehensive coverage across the yield curve. Use this interactive chart to find bond ETFs by asset class, yield, and duration.
Ticker | Name | Sub Asset Class | aladdinStrategyCode | Strategy | Net Assets (USD) | YTD Return (%) | Incept. Date | Net Expense Ratio (%) | Per. As of | productPageUrl | portfolioId | productView | aladdinAssetClassCode | aladdinRegionCode | aladdinMarketTypeCode | aladdinSubAssetClassCode | aladdinCountryCode | Asset Class |
---|---|---|---|---|---|---|---|---|---|---|---|---|---|---|---|---|---|---|
Ticker | Name | Sub Asset Class | aladdinStrategyCode | Strategy | Net Assets (USD) | YTD Return (%) | Incept. Date | Net Expense Ratio (%) | Per. As of | productPageUrl | portfolioId | productView | aladdinAssetClassCode | aladdinRegionCode | aladdinMarketTypeCode | aladdinSubAssetClassCode | aladdinCountryCode | Asset Class |
Ticker | Name | Per. As of | YTD (%) | 1Y (%) | 5Y (%) | 10Y (%) | Incept. (%) | Gross Expense Ratio (%) | Net Expense Ratio (%) | productPageUrl | portfolioId | productView | aladdinAssetClassCode | aladdinStrategyCode | aladdinRegionCode | aladdinMarketTypeCode | aladdinSubAssetClassCode | aladdinCountryCode | Net Assets (USD) | Asset Class | Sub Asset Class |
---|---|---|---|---|---|---|---|---|---|---|---|---|---|---|---|---|---|---|---|---|---|
Ticker | Name | Per. As of | YTD (%) | 1Y (%) | 5Y (%) | 10Y (%) | Incept. (%) | Gross Expense Ratio (%) | Net Expense Ratio (%) | productPageUrl | portfolioId | productView | aladdinAssetClassCode | aladdinStrategyCode | aladdinRegionCode | aladdinMarketTypeCode | aladdinSubAssetClassCode | aladdinCountryCode | Net Assets (USD) | Asset Class | Sub Asset Class |
Fund yields shown are as of the previous business day. The performance quoted represents past performance and does not guarantee future results. Investment return and principal value of an investment will fluctuate so that an investor’s shares, when sold or redeemed, may be worth more or less than the original cost. Current performance may be lower or higher than the performance quoted. Click on the fund’s name or ticker within each pop-up box above to access standardized performance and performance data current to the most recent month end.
"Effective duration" measures the sensitivity of the price of an asset to changes in interest rates. "High Yield" yield curve represented by USD COMPOSITE B CURVE. "Investment Grade" yield curve represented by US Composite BBB BVAL Curve. "Treasury" yield curve represented by US Treasury ActivesCurve. All yields curves as of 12/31/20.
1 BlackRock calculation using fund performance rankings from Morningstar, as of 12/31/20. Comparison universe is ETFs and mutual funds in the Morningstar category and uses total return. Overall figure is a weighted average of the percentage of funds that the iShares and BlackRock bond ETFs have outperformed in each Morningstar category, weighted based on the number of funds in the Morningstar category. The funds outperformed 45%, 46% and 56% of peers on a 1, 5 and 10 year basis, respectively. Performance may be different for other time periods.
2 Morningstar as of 12/31/20. Comparison is between the Prospectus Net Expense Ratio for the average Fixed Income iShares and BlackRock ETF (0.19%) and the average Fixed Income Open-End Mutual Fund (0.69%) available in the U.S. ex money market funds.
3 TRACE and Markit iBoxx from 1/1/20 to 12/31/20.
Carefully consider the Funds' investment objectives, risk factors, and charges and expenses before investing. This and other information can be found in the Funds' prospectuses or, if available, the summary prospectuses, which may be obtained by visiting the iShares Fund and BlackRock Fund prospectus pages. Read the prospectus carefully before investing.
Investing involves risk, including possible loss of principal.
Fixed income risks include interest-rate and credit risk. Typically, when interest rates rise, there is a corresponding decline in bond values. Credit risk refers to the possibility that the bond issuer will not be able to make principal and interest payments.
Non-investment-grade debt securities (high-yield/junk bonds) may be subject to greater market fluctuations, risk of default or loss of income and principal than higher-rated securities.
Transactions in shares of ETFs may result in brokerage commissions and will generate tax consequences. All regulated investment companies are obliged to distribute portfolio gains to shareholders.
Shares of ETFs trade at market price, which may be greater or less than net asset value. The iShares® iBonds® ETFs (“Funds”) will terminate within the month and year in each Fund’s name. An investment in the Fund(s) is not guaranteed, and an investor may experience losses and/or tax consequences, including near or at the termination date. In the final months of each Fund's operation, its portfolio will transition to cash and cash-like instruments. As a result, its yield will tend to move toward prevailing money market rates, and may be lower than the yields of the bonds previously held by the Fund and lower than prevailing yields in the bond market.
International investing involves risks, including risks related to foreign currency, limited liquidity, less government regulation and the possibility of substantial volatility due to adverse political, economic or other developments. These risks often are heightened for investments in emerging/ developing markets or in concentrations of single countries.
Preferred stocks are not necessarily correlated with securities markets generally. Rising interest rates may cause the value of the Fund’s investments to decline significantly. Removal of stocks from the index due to maturity, redemption, call features or conversion may cause a decrease in the yield of the index and the Fund.
There can be no assurance that an active trading market for shares of an ETF will develop or be maintained.
When comparing stocks or bonds and iShares Funds, it should be remembered that management fees associated with fund investments, like iShares Funds, are not borne by investors in individual stocks or bonds.
Diversification and asset allocation may not protect against market risk or loss of principal.
There is no guarantee that dividends will be paid.
The strategies discussed are strictly for illustrative and educational purposes and are not a recommendation, offer or solicitation to buy or sell any securities or to adopt any investment strategy. There is no guarantee that any strategies discussed will be effective.
This material contains general information only and does not take into account an individual's financial circumstances. This information should not be relied upon as a primary basis for an investment decision. Rather, an assessment should be made as to whether the information is appropriate in individual circumstances and consideration should be given to talking to a financial professional before making an investment decision.
The information provided is not intended to be tax advice. Investors should be urged to consult their tax professionals or financial professionals for more information regarding their specific tax situations.
The Funds are distributed by BlackRock Investments, LLC (together with its affiliates, "BlackRock").
The iShares Funds are not sponsored, endorsed, issued, sold or promoted by Barclays, Bloomberg Finance L.P., BlackRock Index Services, LLC, Cohen & Steers Capital Management, Inc., European Public Real Estate Association (“EPRA® ”), FTSE International Limited (“FTSE”), ICE Data Services, LLC, India Index Services & Products Limited, JPMorgan Chase & Co., Japan Exchange Group, MSCI Inc., Markit Indices Limited, Morningstar, Inc., The NASDAQ OMX Group, Inc., National Association of Real Estate Investment Trusts (“NAREIT”), New York Stock Exchange, Inc., Russell or S&P Dow Jones Indices LLC. None of these companies make any representation regarding the advisability of investing in the Funds. With the exception of BlackRock Index Services, LLC, who is an affiliate, BlackRock Investments, LLC is not affiliated with the companies listed above.
Neither FTSE nor NAREIT makes any warranty regarding the FTSE NAREIT Equity REITS Index, FTSE NAREIT All Residential Capped Index or FTSE NAREIT All Mortgage Capped Index; all rights vest in NAREIT. Neither FTSE nor NAREIT makes any warranty regarding the FTSE EPRA/NAREIT Developed Real Estate ex-U.S. Index or FTSE EPRA/NAREIT Global REIT Index; all rights vest in FTSE, NAREIT and EPRA.“FTSE®” is a trademark of London Stock Exchange Group companies and is used by FTSE under license.
© 2021 BlackRock, Inc. All rights reserved. BLACKROCK, BLACKROCK SOLUTIONS, BUILD ON BLACKROCK, ALADDIN, iSHARES, iBONDS, FACTORSELECT, iTHINKING, iSHARES CONNECT, FUND FRENZY, LIFEPATH, SO WHAT DO I DO WITH MY MONEY, INVESTING FOR A NEW WORLD, BUILT FOR THESE TIMES, the iShares Core Graphic, CoRI and the CoRI logo are trademarks of BlackRock, Inc., or its subsidiaries in the United States and elsewhere. All other marks are the property of their respective owners.
iCRMH0221U/S-1529912