Growth at a reasonable price: The case for GARP investing

Priya Panse, CFA; Eric Legunn, CFA Nov 25, 2025 Factors

KEY TAKEAWAYS

  • The long-term outperformance of growth stocks vs. value stocks may have investors wondering how to maintain exposure to exciting growth areas such as Artificial Intelligence, while being mindful of potentially extended valuations.
  • Growth at a Reasonable Price (GARP) investing is a hybrid approach that focuses on identifying growth companies that exhibit favorable value and quality characteristics.
  • Investors looking to stay exposed to powerful growth themes while managing valuation risk may consider the iShares MSCI USA Quality GARP ETF (GARP).
GARP

iSHARES MSCI USA QUALITY GARP ETF

Seek access to high-quality growth companies with reasonable valuations.

WHAT IS GARP INVESTING?

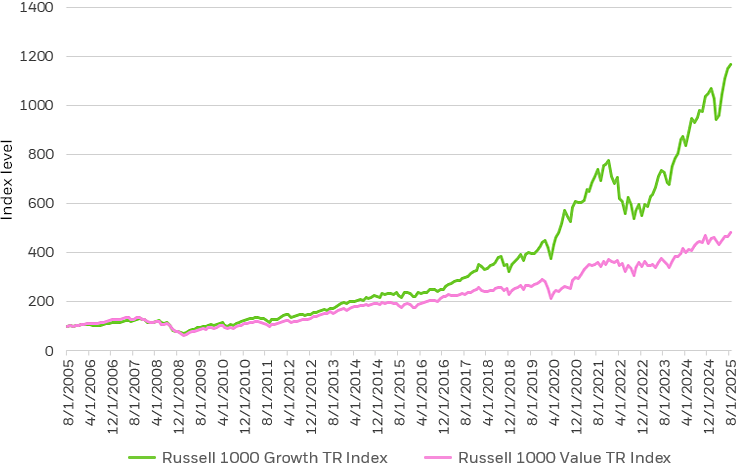
Growth stocks have significantly outperformed value stocks over the past 20 years.1 Investors concerned that the trend may have gone too far, but do not want to completely abandon growth investing may want to consider a hybrid approach, known as GARP, or Growth at a Reasonable Price. GARP seeks to help investors maintain growth exposure — especially in exciting areas like AI — while aiming to not overpay for growth (hence the acronym) by considering valuation levels.

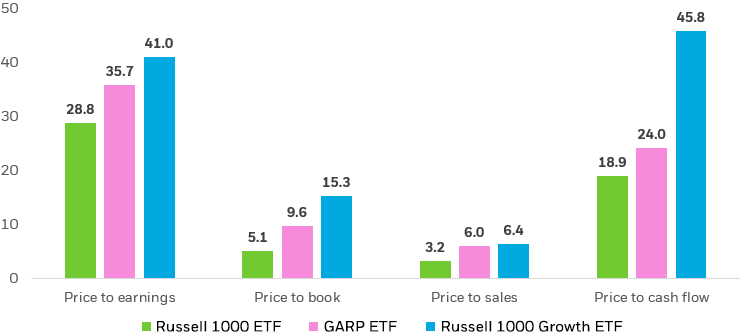
GARP is a hybrid stock-picking style combining growth and value investing. The goal is to find companies with strong earnings growth prospects that aren’t trading at excessive valuations. GARP screens first for growth stocks, then tilts the portfolio toward those with attractive value and quality characteristics.

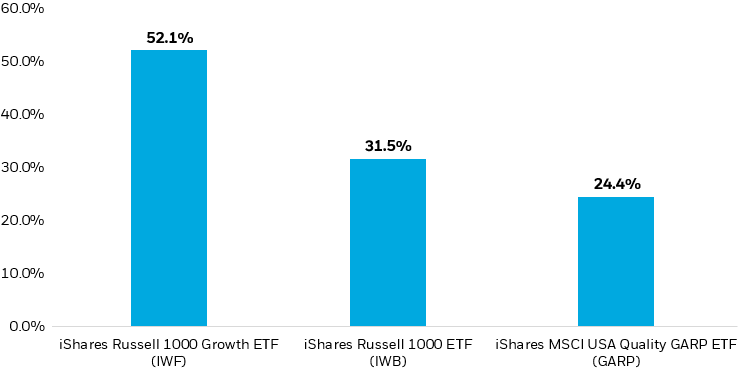
The iShares MSCI USA Quality GARP ETF (GARP), which rose approximately 37% in 2024 and has gained over 22% year to date through October 31, 20252, seeks to help investors maintain growth exposure — while supporting thoughtful security selection that considers valuation and concentration risk.

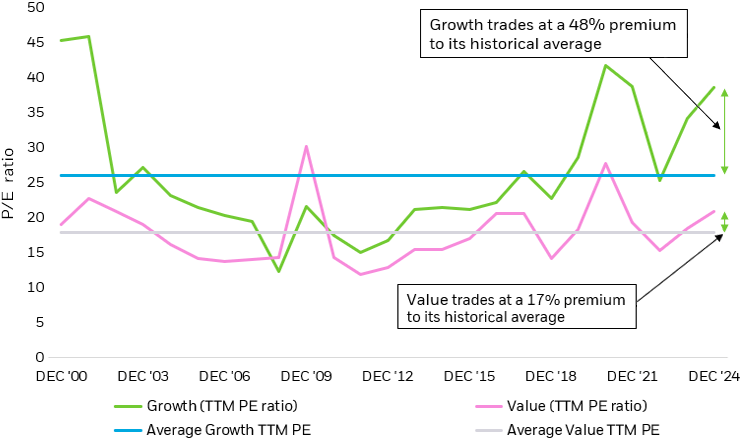
Growth vs. Value: Outperformance and Stretched Valuations

Over the past 20 years, growth stocks have dramatically outperformed value stocks, with a cumulative performance differential of more than 730%.

Russell 1000 Value vs Russell 1000 Growth, last 20 years

Line chart showing the outperformance of the Russell 1000 Growth Total Return Index vs. the Russell 1000 Value Total Return Index for the past 20 years.

Source: FactSet, as of 9/30/2025. Last 20 years of monthly total return data are shown for the Russell 1000 Growth Total Return Index and the Russell 1000 Value Total Return Index. For comparison purposes, the indices are scaled to 100 on 9/30/2005. Index performance is for illustrative purposes only. Index performance does not reflect any management fees or expenses. Indexes are unmanaged and one cannot invest directly in an index. Past performance does not guarantee future results.

Chart description: Line chart showing the outperformance of the Russell 1000 Growth Total Return Index vs. the Russell 1000 Value Total Return Index for the past 20 years.


However, this outperformance has come at a cost: growth exhibits loftier market valuations relative to its own history than value.

Growth valuations are stretched relative to history, more so than for Value

Line chart showing how the iShares Russell 1000 Growth ETF (IWF) trades 48% above its historic average PE compared to the iShares Russell 1000 Value ETF (IWD), which trades 17% above its historic average.

Source: FactSet, BlackRock Calculation. Annual data, as of 12/31/2024. Trailing twelve-month P/E ratios (TTM P/E) for the iShares Russell 1000 growth ETF (IWF) and the iShares Russell 1000 value ETF (IWD), are shown over the last 25 years.

Chart description: Line chart showing how the iShares Russell 1000 Growth ETF (IWF) trades 48% above its historic average PE compared to the iShares Russell 1000 Value ETF (IWD), which trades 17% above its historic average.


At the end of 2024 the price-to-earnings (PE) ratio for growth traded at a 48% premium relative to its historical average, nearly three times higher premium than for value, which exhibited a smaller 17% premium relative to its historical average.3 Investors concerned with such lofty valuation levels, but who do not want to abandon growth investing completely, may consider pursuing GARP investing.

GARP investing allows investors to maintain exposure to high growth-potential names while being mindful of valuation risk. The iShares MSCI USA Quality GARP ETF (GARP), for example, offers a hybrid solution that sits between growth and value — seeking growth as a primary objective but tilting toward value and quality characteristics. As a result, GARP’s portfolio has exhibited lower valuation levels than comparable growth indices, while still higher than the market4 itself, given the growth focus.

Valuation Comparison: Russell 1000 vs. GARP vs. Russell 1000 Growth

Bar chart showing a valuation comparison of the Russell 1000 ETF vs. the iShares GARP ETF vs. the iShares Russell Growth ETF based on price-to-earnings, price-to-book, price-to-sales, and price-to-cashflow.

Source: BlackRock Calculation, FactSet, as of 9/30/2025. Data for the Russell 1000 ETF, GARP ETF, and Russell 1000 Growth ETF is sourced from FactSet Market Aggregates last twelve month price to earnings, last twelve month price to book, last twelve month price to sales, and last twelve month price to cash flow ratios for the iShares Russell 1000 ETF (IWB), iShares MSCI USA Quality GARP ETF (GARP), and iShares Russell 1000 Growth ETF (IWF) respectively.

Chart description: Bar chart showing a valuation comparison of the Russell 1000 ETF vs. the iShares GARP ETF vs. the iShares Russell Growth ETF based on price-to-earnings, price-to-book, price-to-sales, and price-to-cashflow.


GARP still looks like a growth exposure when it comes to a sector perspective. Sector deviations relative to a typical market-cap weighted growth exposure, such as the Russell 1000 Growth Index, have been modest given GARP’s primary objective of delivering a growth exposure.

Sector Exposure: iShares MSCl USA Quality GARP ETF (GARP) vs. iShares Russell 1000 Growth ETF (IWF)

Bar chart showing the sector exposure differences of the iShares MSCI USA Quality GARP ETF vs. the iShares Russell 1000 Growth ETF.

Source: BlackRock, Aladdin, as of 9/26/2025.

Chart description: Bar chart showing the sector exposure differences of the iShares MSCI USA Quality GARP ETF vs. the iShares Russell 1000 Growth ETF.


The result is a portfolio with similar sector exposure relative to the iShares Russell 1000 Growth ETF, but larger differences when it comes to security selection within sectors. One notable example is how GARP has reduced concentration risk in the so-called Magnificent Seven stocks: Apple, Alphabet, Amazon, Meta Platforms, Microsoft, NVIDIA, and Tesla.

Consider the weight of the Magnificent Seven names in the iShares Russell 1000 ETF (IWB), iShares Russell 1000 Growth ETF (IWF), and iShares MSCI USA Quality GARP ETF (GARP).

Magnificent 7 exposure

Bar chart showing the weight of the "Magnificent Seven" names in the Russell 1000 vs. the Russell 1000 Growth, and the iShares MSCI USA Quality GARP ETF.

Source: Morningstar Direct, as of 9/30/2025.

Chart description: Bar chart showing the weight of the "Magnificent Seven" names in the iShares Russell 1000 ETF vs. the iShares Russell 1000 Growth ETF, and the iShares MSCI USA Quality GARP ETF.


As illustrated above, while GARP significantly reduces exposure to the Magnificent Seven, it does not eliminate them. In fact, the only Magnificent Seven stock that GARP fully excludes per its methodology, which considers value and quality characteristics in addition to growth, is Tesla.5 We view that still having nearly 25% of the fund’s overall stock exposure in the Magnificent Seven is an important feature of GARP, since they have been key market-driving names. (Specific companies or issuers are mentioned for educational purposes only and should not be deemed as a recommendation to buy or sell any securities. Any companies mentioned do not necessarily represent current or future holdings of any BlackRock products. Fort actual fund holdings, please visit the respective fund product pages.)

CONCLUSION

We believe GARP’s blend of growth and value is especially timely given the Fed’s recent pivot to rate cuts and the possibility that the economy may begin to slow. GARP seeks both offensive and defensive characteristics by focusing on companies with strong fundamentals, more reasonable valuations, and quality metrics. In portfolios, GARP can potentially complement core holdings, diversify existing growth exposures, and potentially reduce concentration risk without sacrificing exposure to key growth themes in today’s markets.

FEATURED FUNDS

  • iShares ETFs are available to purchase through a brokerage account or with a financial advisor.

    Buy through your brokerage

    iShares funds are available through online brokerage firms. All iShares ETFs and ETPs trade commission free online through Fidelity.

    By clicking on the button below, you will leave BlackRock’s website.

    Buy now on Fidelity

    Contact your advisor

    Contact a financial professional to discuss how iShares ETFs and ETPs can fit in your investment portfolio.

    Carefully consider the Funds' investment objectives, risk factors, and charges and expenses before investing. This and other information can be found in the Funds' prospectuses or, if available, the summary prospectuses, which may be obtained by visiting the iShares ETF and BlackRock Fund prospectus pages. Read the prospectus carefully before investing. Investing involves risk, including possible loss of principal.

    Any links to third-party websites are provided for use at your own discretion. Each third party is solely responsible for the content presented and availability of its website. BlackRock does not control, monitor or maintain third-party websites, their content or the products/services they offer. Content may change without notice. When you leave BlackRock’s website and enter a third-party website, you will be subject to that site’s terms, policies and/or notices, including those related to privacy and security, as applicable. Please review those policies and notices on the third-party website.

    Before engaging Fidelity or any broker-dealer, you should evaluate the overall fees and charges of the firm as well as the services provided. Free commission offer applies to online purchases of select iShares ETFs in a Fidelity account. The sale of ETFs is subject to an activity assessment fee (from $0.01 to $0.03 per $1,000 of principal). For iShares ETFs, Fidelity receives compensation from the ETF sponsor and/or its affiliates in connection with an exclusive long-term marketing program that includes promotion of iShares ETFs and inclusion of iShares funds in certain Fidelity Brokerage Services platforms and investment programs. Please note, this security will not be marginable for 30 days from the settlement date, at which time it will automatically become eligible for margin collateral. Additional information about the sources, amounts, and terms of compensation can be found in the ETF’s prospectus and related documents. Fidelity may add or waive commissions on ETFs without prior notice.

    The Funds are distributed by BlackRock Investments, LLC (together with its affiliates, “BlackRock”).

    ©2024 BlackRock, Inc or its affiliates. All Rights Reserved. BLACKROCK, iSHARES, iBONDS, LIFEPATH, ALADDIN and the iShares Core Graphic are trademarks of BlackRock, Inc. or its affiliates. All other trademarks are those of their respective owners.

    iCRMH1124U/S-3985892

Photo: Priya Panse, CFA

Priya Panse, CFA

Lead Strategist, Factor & Alternative ETFs

Photo: Eric Legunn, CFA

Eric Legunn, CFA

Strategist, Factor & Alternative ETFs