Why iShares
Our Core ETF product line-up simplifies our offering of over 300+ ETFs to the basic building blocks of an investment portfolio. With just a handful of funds you can create a low-cost, diversified set of holdings.
Low cost
iShares Core ETFs are low cost and help you invest more of your hard earned money.
Competitive performance
iShares Core ETFs have offered competitive performance for over 20 years.1
Tax efficient
Over the past 5 years, iShares Core equity stylebox ETFs have not distributed any capital gains.2
Keeping costs low can help you reach your investment goals sooner.
Expense ratio for iShares Core equity ETFs compared to active open-end equity mutual funds.

Source: Morningstar, as of 9/30/2025. Comparison is between the average Prospectus Net Expense Ratio for the iShares Core ETFs (0.05%) and actively managed open-end mutual funds in the 9 style box Morningstar categories using the oldest share class to avoid duplicates (0.88%).
Chart description: Bar chart of comparing net expense ratios of active open-ended mutual funds average to iShares Core ETFs.
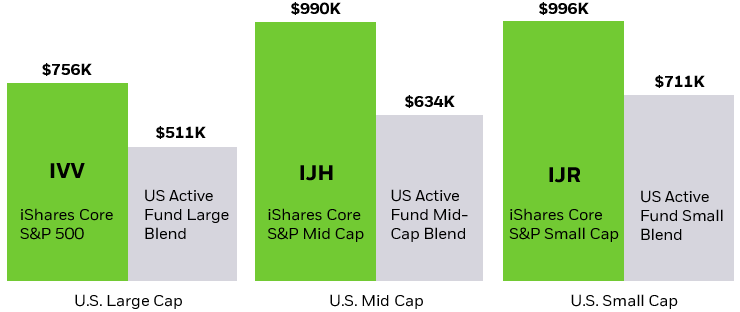
iShares Core ETFs offer broad stock and bond exposures by seeking to track high-quality, established indexes. Over time, the performance can really add up.
Hypothetical growth of $10,000 over 20+ years (05/22/2000 to 9/30/2025)

Source: Morningstar as of 9/30/2025. The chart above reflects a hypothetical $10,000 investment and assumes reinvestment of dividends and capital gains. Fund expenses, including management fees and other expenses were deducted. The three active categories shown (US Active Fund Large Blend, US Active Fund Mid-Cap Blend, and US Active Fund Small Blend) are averages calculated by Morningstar that represent the equally weighted return for all actively managed mutual funds in the respective Morningstar Category.
Performance data represents past performance and does not guarantee future results. Investment return and principal value will fluctuate with market conditions and may be lower or higher when you sell your shares. Current performance may differ from the performance shown. For most recent month end performance and standardized performance, click here.
Char description: Bar chart of hypothetical growth of $10,000 over 20 years where iShares Equity ETFs outperform US mutual fund averages.
Did you know that many funds pay distributions while you’re still invested — and you pay capital gains taxes on those even if you don’t sell? Over the past 5 years, 0% of iShares U.S. Core equity style box ETFs paid out taxable capital gains distributions, compared to 76% of U.S. active equity mutual funds. The potential effects of taxes can be more detrimental to portfolio returns than fees.
Percentage of funds that paid capital gains over the last 5 years

Source: BlackRock as of 12/31/2024; Morningstar average of years 2019 to 2024 as of 12/31/2024. US Active Equity Mutual Funds represented by the oldest share class of each Active Open-End Equity Mutual Fund available in the United States incepted before 10/31 in each year and excludes funds that closed before 10/31 in each year, as of 12/31/2024.
Past distributions are not indicative of future distributions.
Chart description: Chart showing that 0% of iShares Core Equity ETFs paid capital gains vs 76% of US active equity mutual funds paid capital gains.

INVESTOR TOOL
Build an ETF portfolio
See how iShares Core ETFs work together as the building blocks for a low-cost, diversified portfolio in iShares Portfolio Builder.
Get started today
Three easy ways to create a portfolio using iShares Core ETFs.
You can use the featured funds below — a selection of US and international stocks and bonds — to get started by mixing and matching these building block ETFs to form a whole, diversified portfolio.
If you are looking for efficient access to markets in a more streamlined solution, consider choosing just one ETF for U.S. stocks, one for international stocks and one for bonds.
If you’d prefer an all-in-one solution, each of these Core ETFs holds a customized combination of stock and bonds based on investing style.

