2025 ETF & ETP Market Trends: Flow and Tell year in review

Key takeaways

  • ETF flows set new records in 2025 amid a broad-based rally in markets.
  • A record number of ETFs listed this year, led by active ETFs at 83% of the tally.
  • Investors shifted their behavior in 2025 judging by flows, buying dips in U.S. equities and taking significant exposure to commodities, led by gold.
IBIT

iShares Bitcoin Trust ETF

Seeks to reflect generally the performance of the price of Bitcoin.

SGOV

iShares 0-3 Month Treasury Bond ETF

Seeks to track the investment results of an index composed of U.S. Treasury bonds with remaining maturities less than or equal to three months.

TOPT

iShares Top 20 U.S. Stocks ETF

Seeks to track the performance of the 20 largest U.S. stocks by market capitalization.

The iShares Trusts are not investment companies registered under the Investment Company Act of 1940, and therefore are not subject to the same regulatory requirements as mutual funds or ETFs registered under the Investment Company Act of 1940. Investments in these products are speculative and involve a high degree of risk.

What were 2025’s ETF & ETP market trends?

ETF and ETP flows set records in 2025, a year when markets delivered robust, broad-based returns despite sweeping tariff announcements, persistent policy uncertainty, and the longest U.S. federal government shutdown on record. Heading into December, the S&P 500 was up 18% for the year (after notching 36 fresh all-time highs), developed markets gained 27%, and emerging markets topped the leaderboard at 30%.1 Fixed income posted strong performance, while correlations to equities dipped lower.

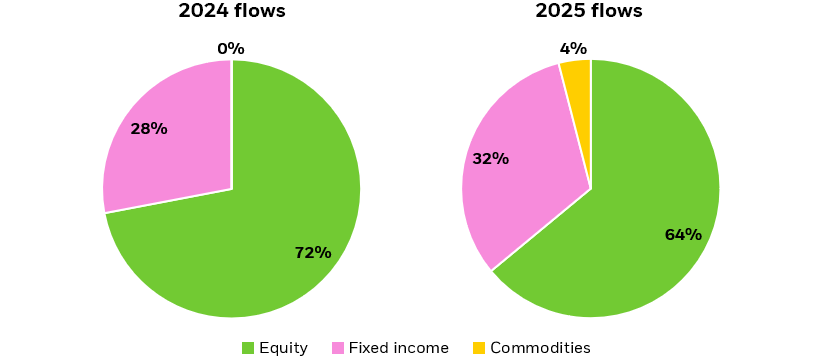
U.S.-listed ETFs added over $1.3 trillion in inflows in 2025 through early December, already surpassing 2024’s record with four weeks to go. Q4 kept up the record quarterly inflows pace for the year, adding $341 billion, with gains across all asset classes.

This is nearly double the average quarterly flow since 2020.

To recap 2025’s ETP & ETF market trends, we’ve identified 10 key themes that defined the year.

Momentum has been broad-based: equity ETFs are ahead of the prior year’s pace, while fixed income ETFs have already exceeded their 2024 totals by 30%. Commodities and alternatives have also set new records.

Launches have kept pace with inflows: a record number of ETFs came to market this year, with new launches surpassing 1,000 for the first time, pushing the number of U.S.-listed ETFs above the number of U.S.-listed companies.2 Active funds dominate the slate: 84% of the year’s new products  were actively managed, and active ETFs now outnumber indexed ones, representing 54% of all industry funds.3

Figure 1: New U.S. ETF launches

Stacked bar chart showing total number of US listed ETF launches by year, as well as proportion of launches that are actively managed.

Source: BlackRock, Bloomberg, as of 12/3/25.

Chart description: Stacked bar chart showing total number of US listed ETF launches by year, as well as proportion of launches that are actively managed.


Investors continued to buy during market pullbacks in 2025 — a departure from past behavior. Since the start of 2025, average weekly flows into U.S. equity ETFs accelerated after a negative S&P 500 week, rising 13%. That contrasts with 2024, when weekly flows fell 18% following a downturn.

For example, the S&P 500 declined 9.1% in the week ending April 4 — its largest weekly loss of the year to date as tariff announcements weighed on performance. Yet the following week, U.S. equity ETFs took in $27 billion, nearly 70% above their average weekly inflow. The largest second half drawdown came in the week ending October 10, with the index down 2.4%; but U.S. equity ETF flows again rose the next week, totaling over $31 billion. (Learn more about the economic and portfolio impact of tariffs.) 

Fixed income ETFs have added nearly $100 billion more than 2024’s record annual haul — reaching over $384 billion for 2025, with four weeks left in the year.4 Flows were broad-based: government bond ETFs took in twice as much as they did in 2024, corporate bond inflows rose, and inflation-protected ETFs added $12 billion after three consecutive years of outflows.

Momentum behind active fixed income allocations continued, with active ETFs capturing a record 38% of total fixed income inflows in 2025, for $146 billion.5 That share was even higher than active ETF funds footprint across all asset classes (33%), and within equities (34%).

Figure 2: Active ETFs account for nearly 40% of fixed income flows in 2025

Stack bar chart showing proportion of flows into active vs indexed fixed income ETF flows in billions by year.

Source: Bloomberg, BlackRock, as of 12/3/25.

Chart description: Stack bar chart showing proportion of flows into active vs indexed fixed income ETF flows in billions by year.


Ultra-short allocations led Treasury flows, accounting for 53% of total fixed income inflows in 2025 — nearly double 2024’s share. The iShares 0-3 Month Treasury Bond ETF (SGOV) topped the fixed income industry leaderboard with more than $35 billion in inflows, extending its streak to 25 straight months of inflows. But in H2, flows showed a more balanced pattern: ultra-short exposures still led, while intermediate- and long-term allocations steadily increased as the Federal Reserve resumed its easing cycle and cash rates declined.6

Developed and emerging markets are on track to comfortably outperform the U.S. this year — a sharp reversal from last year, when the S&P 500 beat both by 21% and 17%, respectively.7 This year also breaks from longer-run patterns: over the last 20 years, both groups have lagged the U.S. on average.

But U.S. equity underperformance did little to temper positive sentiment toward the sector. ETF flows into U.S. equities beat long-term monthly averages every month of 2025 — though investors pivoted slightly. In Q2, flows into U.S. equities fell to just 62% of total inflows, roughly 10% below their historical average. That shift was especially stark on the heels of 2024, when U.S. equities captured over 80% of total flows. But the rotation proved more of a trade than an enduring shift: by Q3 and Q4, flows into U.S. equity ETFs had moved back in change line with their 10-year averages.

Small caps are on track for a third consecutive year of double-digit returns, topping 15% so far this year on optimism for a more dovish monetary policy trajectory.8 But ETF flows point to an unwind rather than an add: small cap ETFs are on pace for their largest annual outflow on record, both on absolute terms (down $7.9 billion), and relative to total equity allocations.

Figure 3: Small caps see outflows despite positive performance

Bar chart comparing quarterly ETF flows in billions to quarterly returns for Small Caps ETFs since Q1 2024.

Source: Bloomberg, BlackRock. Small cap performance as represented by Russell 2000 Index, ETF flows as grouped by Bloomberg, as of 12/4/25. Indexes are unmanaged and one cannot invest directly in an index. Past performance does not guarantee future results.

Chart description: Bar chart comparing quarterly ETF flows in billions to quarterly returns for Small Caps ETFs since Q1 2024.


All 11 sectors in the S&P 500 are on track to end the year higher, a departure from recent trends. In turn, investors have leaned into sectoral bets more heavily than past years — sector allocations accounted for nearly 10% of all equity ETF flows this year, more than double 2024’s 4% share. Tech anchored sector flows, adding $38 billion, and saw inflows in 10 of the past 11 months.

Energy rounded out the flow laggards, seeing $5 billion in outflows, despite early momentum into Q1.

Figure 4: Tech led ETF sector flows

Dot chart plotting S&P sectors based on their YTD returns on the Y axis and annual returns on the X axis.

Source: Bloomberg, BlackRock, sector grouping for ETF flows as determined by Bloomberg, sector grouping for performance as determined by GICS, as of 12/2/25.

Chart description: Dot chart plotting S&P sectors based on their YTD returns on the Y axis and annual ETF flows on the X axis.


Growth equity ETFs started the year with $18 billion in inflows in January — and value trailed, netting under $1 billion that month, even amid slight outperformance.9 But from February to March, value flows reversed, outpacing growth as investors sought more defensive allocations.

The rotation reversed in May, and growth largely topped value for the remainder of the year — adding $29 billion in Q3 vs. value’s $19 billion and widening the spread in Q4 to $32 billion in growth inflows vs. value’s $18 billion.

Gold prices continued to move higher, rising nearly 60% in 2025 to top $4,000/oz for the first time, benefitting from both structural buying from central banks and tactical buying from retail.10 Performance has translated into recording-breaking ETP inflows: gold ETPs have added nearly $43 billion so far this year, dwarfing last year’s $1.6 billion net flows.

Using ETP flows a proxy for portfolios, 2024’s mix resembled a 70/30 split between equities and fixed income, with commodities rounding to 0% — an improvement from the prior year, when commodity flows were negative. In 2025, that picture has shifted meaningfully: commodities now account for 4% of the overall flow mix.

Figure 5: Commodity flows increase in 2025 to figure more prominently in portfolios

Pie chart showing proportion of ETF flows into the asset classes of equity, fixed income, and commodities for 2025 YTD and 2024.

Source: BlackRock, Bloomberg. Groupings determined by Bloomberg, as of 12/3/25. For illustrative purpose only.


Chart description: Pie chart showing proportion of ETP flows into the asset classes of equity, fixed income, and commodities for 2025 YTD and 2024.


Bitcoin faced a volatile year, hitting a record above $125,000 in early October, before reversing and giving back its gains for the year.11

Cryptocurrency ETPs added $17.4 billion in H1 — the cohort’s largest first-half haul in two years of trading. But demand has mirrored performance, with the asset class seeing outflows in November. The iShares Bitcoin Trust ETF (IBIT), posted its first month of outflows on record in November, shedding $2.3 billion. But while industry-wide spot Bitcoin ETP flows are on track to soften slightly from 2024, netting just over $22 billion, Ethereum ETPs have added nearly four times their 2024 totals, to $10.3 billion.

3 funds with exposure to some of this year’s biggest themes

  • iShares ETFs are available to purchase through a brokerage account or with a financial advisor.

    Buy through your brokerage

    iShares funds are available through online brokerage firms. All iShares ETFs and ETPs trade commission free online through Fidelity.

    By clicking on the button below, you will leave BlackRock’s website.

    Buy now on Fidelity

    Contact your advisor

    Contact a financial professional to discuss how iShares ETFs and ETPs can fit in your investment portfolio.

    Carefully consider the Funds' investment objectives, risk factors, and charges and expenses before investing. This and other information can be found in the Funds' prospectuses or, if available, the summary prospectuses, which may be obtained by visiting the iShares ETF and BlackRock Fund prospectus pages. Read the prospectus carefully before investing. Investing involves risk, including possible loss of principal.

    Any links to third-party websites are provided for use at your own discretion. Each third party is solely responsible for the content presented and availability of its website. BlackRock does not control, monitor or maintain third-party websites, their content or the products/services they offer. Content may change without notice. When you leave BlackRock’s website and enter a third-party website, you will be subject to that site’s terms, policies and/or notices, including those related to privacy and security, as applicable. Please review those policies and notices on the third-party website.

    Before engaging Fidelity or any broker-dealer, you should evaluate the overall fees and charges of the firm as well as the services provided. Free commission offer applies to online purchases of select iShares ETFs in a Fidelity account. The sale of ETFs is subject to an activity assessment fee (from $0.01 to $0.03 per $1,000 of principal). For iShares ETFs, Fidelity receives compensation from the ETF sponsor and/or its affiliates in connection with an exclusive long-term marketing program that includes promotion of iShares ETFs and inclusion of iShares funds in certain Fidelity Brokerage Services platforms and investment programs. Please note, this security will not be marginable for 30 days from the settlement date, at which time it will automatically become eligible for margin collateral. Additional information about the sources, amounts, and terms of compensation can be found in the ETF’s prospectus and related documents. Fidelity may add or waive commissions on ETFs without prior notice.

    The Funds are distributed by BlackRock Investments, LLC (together with its affiliates, “BlackRock”).

    ©2024 BlackRock, Inc or its affiliates. All Rights Reserved. BLACKROCK, iSHARES, iBONDS, LIFEPATH, ALADDIN and the iShares Core Graphic are trademarks of BlackRock, Inc. or its affiliates. All other trademarks are those of their respective owners.

    iCRMH1124U/S-3985892

All data is sourced by Bloomberg and calculated by BlackRock unless otherwise noted. As of 12/3/25. The iShares Trusts are not investment companies registered under the Investment Company Act of 1940, and therefore are not subject to the same regulatory requirements as mutual funds or ETFs registered under the Investment Company Act of 1940.

The iShares Bitcoin Trust ETF is not an investment company registered under the Investment Company Act of 1940, and therefore is not subject to the same regulatory requirements as mutual funds or ETFs registered under the Investment Company Act of 1940.
Photo: Kristy Akullian, CFA

Kristy Akullian, CFA

Head of iShares Investment Strategy for the Americas

Faye Witherall

Investment Strategist

Contributor

Annie Khanna

Investment Strategist

Contributor

John Huebner

Investment Strategist

Contributor

Aaron Task

Content Specialist

Contributor