Fed Outlook 2026: Rate forecasts and fixed income strategies

Key takeaways

  • Rising inflation and a strong labor market have shifted expectations for Fed policy in 2026. The central bank is holding the federal funds rate at 3.50% to 3.75%. The forward path of rates has become less certain, with the current fed funds future pricing in 4% by year end.1
  • New Chairman Kevin Warsh announced Five Task Forces that will examine how the Fed makes decisions and communicates to the market - with less focus on forward guidance. The Central Bank may wait until the findings from the task forces before making any policy changes.
  • Given this current backdrop, we see opportunities for investors to put cash to work, manage interest rate risk with intermediate maturities, build bond ladders and seek higher income outside of core bonds.
SGOV

iShares 0-3 Month Treasury Bond ETF

Pursue yield with the largest Treasury ETF in the market.2

LDRC

iShares® iBonds® 1-5 Year Corporate Ladder ETF

Build a bond ladder and seek income from investment grade corporate credit.

BINC

iShares Flexible Income Active ETF

Get direct access to harder-to-reach fixed income sectors through active management.

What is the Fed outlook for 2026?

The outlook for Fed policy has shifted significantly in 2026. Market participants entered the year expecting rate cuts but are now pricing the possibility of multiple rate hikes by year end.3 Our baseline scenario is for the Fed to remain on pause for the remainder of 2026 but acknowledge investors face greater uncertainty around future FOMC policymaking for three key reasons:

  • The Fed is navigating a shifting geopolitical, technological and economic landscape as it aims to focus on its dual mandate of price stability and full employment. The economy remains resilient, but growth is becoming more uneven.
  • Inflation remains above the Fed’s 2% target, and the U.S. labor market has been concentrated in certain sectors.4
  • New Fed chair Kevin Warsh launched five new policy task forces, reflecting areas where Chair Warsh is considering the largest changes to existing Fed policy. In his first press conference as FOMC chair, Warsh reiterated his aversion to forward guidance several times, which we expect to translate to greater rate volatility.5

For investors, we believe bonds offer a compelling opportunity set for income generation. We believe higher Treasury yields reflect strong economic growth rather than purely inflation pressures. We continue to favor the front end and belly of the yield curve (maturities under 10 years), where investors can earn attractive income while maintaining flexibility. Investors can also seek income with corporate credit, securitized assets, and emerging market bonds.

What are fed funds futures signaling?

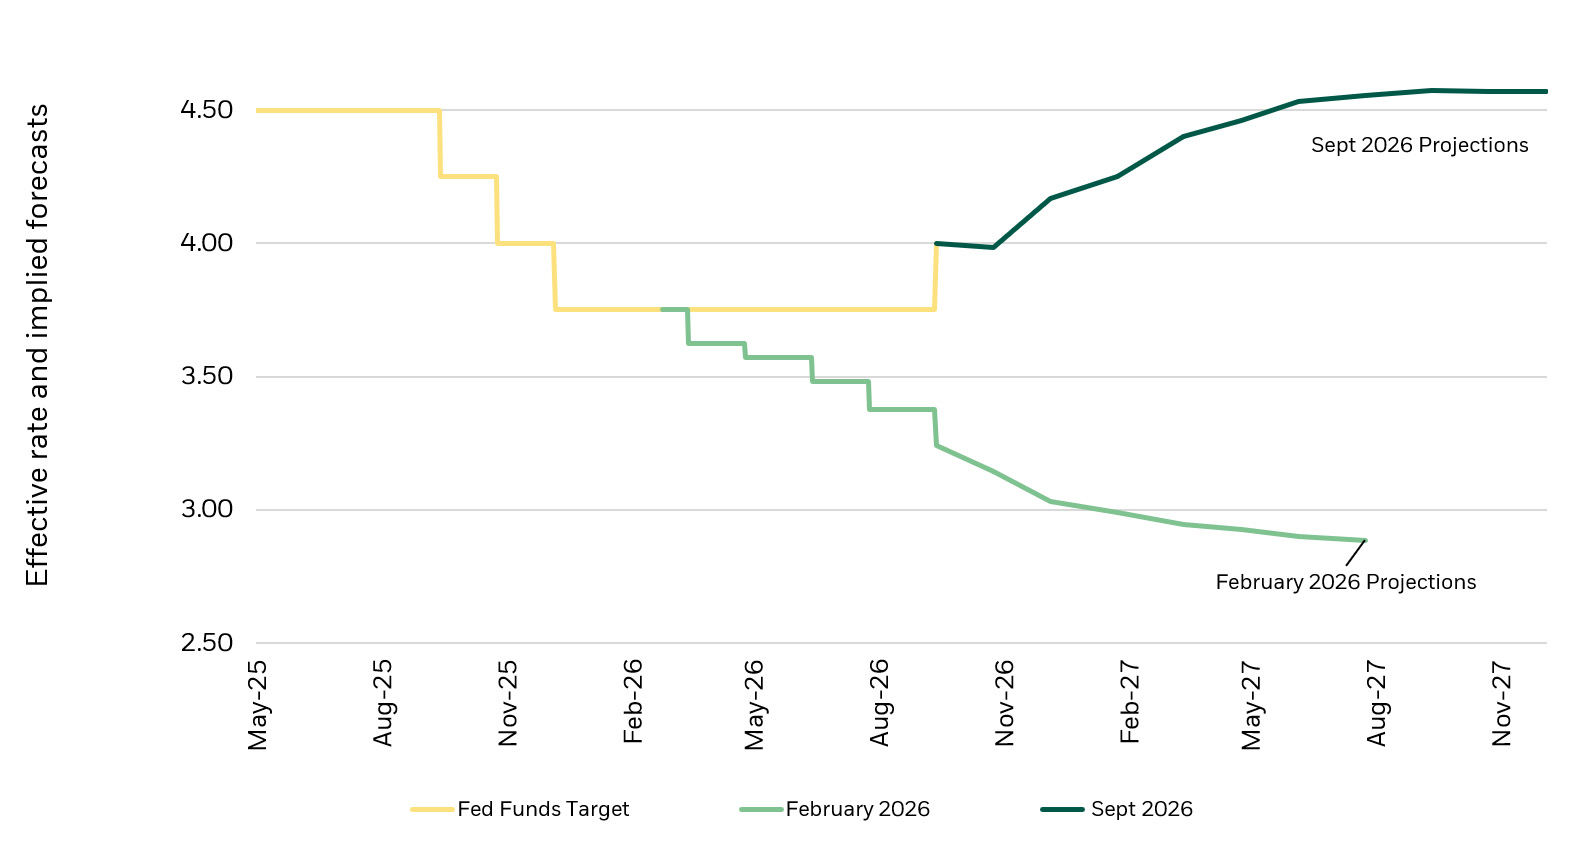
At the beginning of 2026, the market was pricing in rate cuts by the Fed but is currently pricing in multiple rate hikes this year.6 The Fed’s forward guidance has shifted from dovish to hawkish as supply shocks to the energy market contributed to inflation above the Fed’s 2% target for the fifth year.7

The unemployment rate is holding in at 4.2% but recent jobs gains have been concentrated in a few sectors.8

About face: Markets now pricing in a hike towards the end of 2026

chart showing fed funds rates and market expectations

Source: Bloomberg and ICAP using the daily fed funds effective rate and prices of fed funds futures contracts on 2/27/2026 and 6/22/2026.

Chart Description: This is a line chart showing the effective fed funds rate and how market expectations of future Fed policy have shifted from rate cuts in February 2026 to rate hikes in June 2026.


How Kevin Warsh may change FOMC policy

The Summary of Economy projections, known as the Dot Plot, was first released in 2012 to improve transparency. However, Chairman Warsh did not submit an estimate for the June 2026 meeting, his first as Fed Chair, and mentioned an aversion to forward guidance during the press conference.

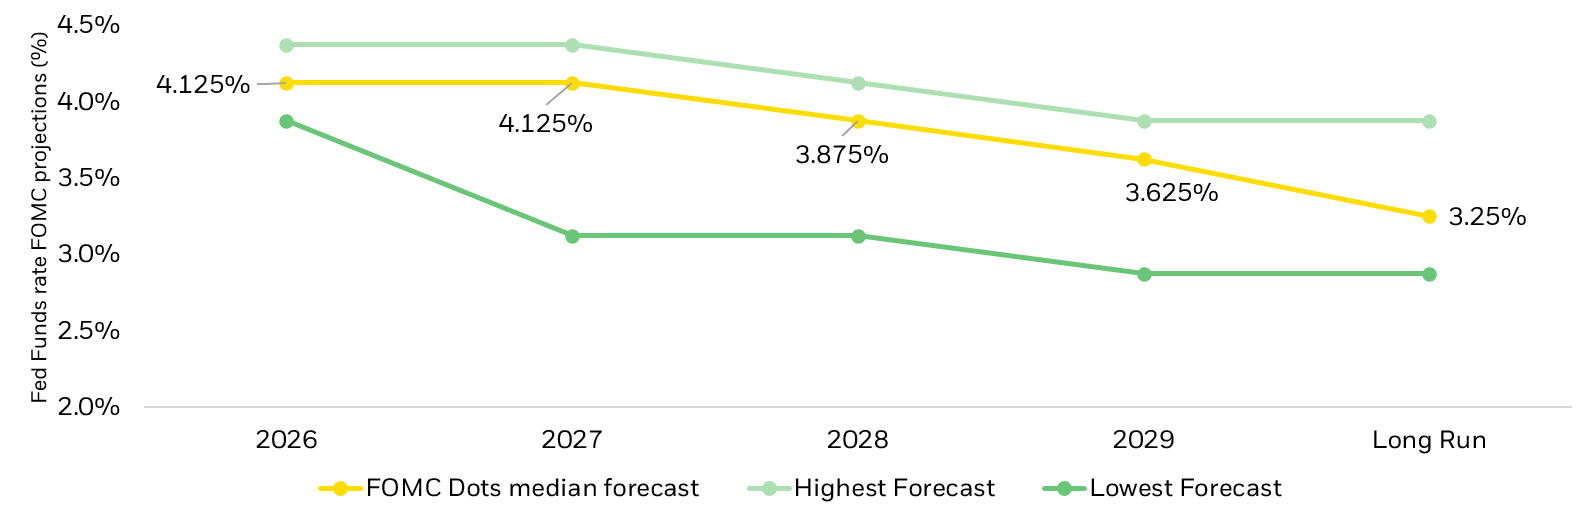
In contrast to earlier in the year, the June 2026 Dot Plot demonstrated a potential hiking bias among FOMC members. While the June vote to keep the fed funds rate unchanged at 3.5% to 3.75% was unanimous, the Dot Plot implied a lot of dispersion about the path of rates.

The Dot Plot reveals nine of 18 dots showed preference for at least one hike this year. The June Summary of Economic projections also increased the outlook for inflation and lower unemployment and economic growth rates.9

In reaction to the FOMC’s June meeting, the bond market priced in a higher likelihood of rate hikes should inflation remain elevated, as evidenced by the fed funds futures markets.10 

Figure 2: Dot Plot reveals a wider distribution of future rate paths

dot plot showing expected short term interest rates

Source: US Federal Reserve as of 6/17/2026.

Chart description: This is a line chart showing the median average and high and low estimates of the Fed's "dot plot", which tracks where FOMC policymakers expect short-term interest rates to be over the next few years and in the long run.


What are the Fed's five new task forces?

Chairman Warsh announced the creation of five Task Forces: Communications, the Balance Sheet, Data Sources, Productivity and Jobs, and the Inflation Framework.

These task forces will gather data and make recommendations before the end of the year. A likely scenario is the Fed remains on pause until the task force has findings later the year. Be on the lookout for announcements that will signal changes to how the central bank approaches these issues.

What does the Fed balance sheet mean for interest rates?

Since the Global Financial Crisis, the Fed has increased its use of its balance sheet—the ability to hold U.S. Treasury, agency debt and mortgage-backed securities (MBS) — as a means of governing the supply and demand for longer-term interest rates, which generally fall outside the scope of its fed funds rate.

By buying bonds, the Fed aimed to lower long-term interest rates, making borrowing cheaper and stimulating economic activity. This process is known as quantitative easing.

Conversely, by reducing holdings through bonds sales or letting bonds mature the Fed can exert upward pressure on interest rates, or a so-called quantitative tightening of monetary conditions.

A new task force on the balance sheet will evaluate both the size and composition of the Fed’s balance sheet, while providing the banking system with ample reserves. No new announcements were made at the June meeting aside from the task force creation. The Fed’s balance sheet is $6.7 trillion or 21% of nominal GDP – but has declined by $2.2 trillion since June 2022.11

Look for future announcements about the pace of the runoff changing, which may contribute to interest rate volatility.

How can investors position fixed income portfolios?

Under this market backdrop, here are some ways investors can use bond ETFs to position their portfolios:

  • Put cash to work: If overnight interest rates stay higher for longer, investors could consider allocating to 0-to-3 month Treasuries or diversified short duration bonds. Investors interested in short-term bonds may consider the iShares 0-3 Month Treasury Bond ETF (SGOV).
  • Reduce long-end exposure: With the Fed reducing forward guidance, there may be more interest rate volatility. Investors interested in reducing exposure to 10-plus year bonds, which have the most interest rate risk, may consider the iShares 1-10 Year Treasury Bond ETF (GOVM). 
  • Build bond laddersBond ladders hold an equal weight to each calendar year and can allow investors to potentially lock in income despite changes in interest rates. The iShares iBonds 1-5 Year Corporate Ladder (LDRC) offers exposure to a professionally managed corporate bond ladder.
  • Seek higher income: Potentially boost fixed income returns with higher yielding bonds, such as high yield, emerging markets, bank loans and collateralized loan obligations (CLOs). Investors interested in higher yielding bonds may consider the iShares Broad USD High Yield Corporate Bond ETF  (USHY), the iShares J.P. Morgan USD Emerging Markets Bond ETF (EMB), the iShares Flexible Income Active ETF (BINC) and the  iShares AAA CLO Active ETF (CLOA).


Frequently asked questions

The Federal Reserve is expected to remain cautious as inflation remains above target and economic growth moderates. Markets have shifted from expecting rate cuts to pricing in the possibility of rate hikes this year.

Persistent inflation, a resilient labor market and changes in Federal Reserve leadership have increased uncertainty around future FOMC decisions.

Kevin Warsh is the new Federal Reserve Chairman. In his first policy meeting as Chairman, Warsh introduced five new policy review task forces that may influence future monetary policy and central bank communications.

Fed funds futures reflect market expectations for future Federal Reserve policy rates and provide insight into how investors expect interest rates to evolve.

Bond ETFs may help investors manage duration, seek income, maintain liquidity and diversify fixed income exposure during periods of changing monetary policy.

Featured funds

Photo of Karen Veraa-Perry, CFA

Karen Veraa-Perry, CFA

Head of U.S. iShares Fixed Income Strategy