Gold and silver: Price, market volatility, and what's next

Gold and silver surged to record highs in January, benefiting from an alignment of factors: rising global debt and heightened geopolitical fragmentation, plus surging central bank demand for gold, and AI driven industrial use for silver.

But both metals saw their largest single-day declines in more than three decades at the end of January after the announcement of Kevin Warsh as the nominee for Federal Reserve Chair prompted a rally in the dollar. While some of the dip was likely attributed to technical factors the speed of the sell-off surprised many investors.

  • Gold: The price of gold has soared 75% in the past year, surpassing $5,000/oz for the first time in January, before tumbling 12% on Jan 30.1
  • Silver: Silver rose by 148% in 2025, adding another 19% in January — even after accounting for the 26% decline on Jan 30th.2

After a record run — and a sharp decline — where do precious metals go from here? And how do they fit into investor portfolios? We break it down below.

IAU

iShares Gold Trust

Get convenient, cost-effective access to physical gold.

SLV

iShares Silver Trust

Seek exposure to the day-to-day movement of the price of silver.

RING

iShares MSCI Global Gold Miners ETF

Seek targeted access to global gold mining stocks.

GSG

iShares S&P GSCI Commodity-Indexed Trust

Express a view on a broad basket of commodities.

What’s driving gold and silver prices?

There are three key drivers of recent performance in precious metals:

1. Mounting government debts.

Government debt levels have risen to concerning levels globally. In the U.S., federal debt now exceeds 120% of GDP, while annual fiscal deficits continue to run near 6–7% of GDP. And the U.S. is not alone: government debt has also surpassed 100% of GDP in major developed economies like Japan, the U.K., France and Canada.3

Gold’s role as a potential store of value with no sovereign issuer risk has historically resonated in such environments.4 Silver has often behaved as a higher-beta extension of this theme, though its pricing reflects a combination of investment flows and industrial demand. Over the past 20 years, silver’s annualized volatility has been up to twice that of gold, underscoring its more cyclical nature.5

By some metrics, silver now trades rich relative to its longstanding relationship to gold. The gold-silver price ratio has narrowed to around 45x, below its historical range of 50x-90x.6

2. Political and geopolitical uncertainty.

Many investors view gold as an inflation hedge when, in truth, the relationship between gold and inflation is nuanced. Gold tends to trade in closer relationship to real rates and the dollar vs. inflation per se. Notably, spot gold prices were rangebound in 2021, when U.S. inflation rates surged.

Rather than an inflation hedge, gold can be viewed as a hedge against geopolitical risks, which have risen sharply in the past year according to BlackRock’s Geopolitical Risk Indicator.

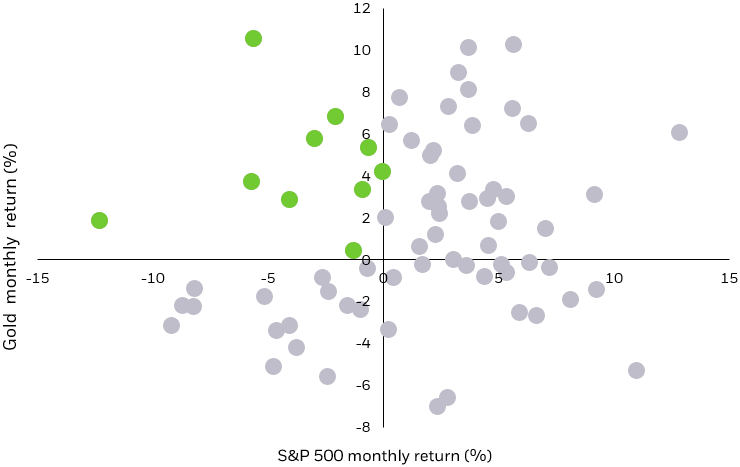
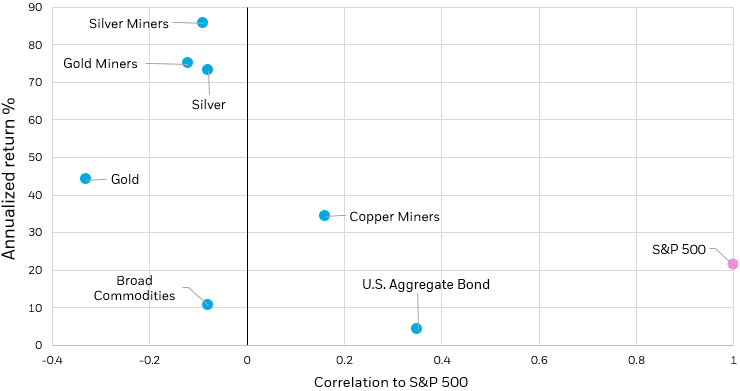
Rather than viewing precious metals purely as a haven, we believe they are best understood as portfolio stabilizers that have historically shown low or negative correlation to equities during periods of market stress.

Diversification matters most when equities are falling. Since 2020, during months when the S&P 500 declined more than 5%, gold has delivered an average return of 2%, while the U.S. Aggregate Bond has been closer to flat.7 This asymmetry makes gold particularly valuable in drawdown scenarios.

Figure 1: Out of 25 down months for stocks, gold saw positive returns 40% of the time

Scatterplot showing monthly returns for gold on the y-axis and monthly S&P returns on the X-axis.

Source: Bloomberg. S&P GSCI Gold Spot. Monthly returns 2020-2025. As of December 31, 2025. Index performance is for illustrative purposes only. Index performance does not reflect any management fees or expenses. Indexes are unmanaged and one cannot invest directly in an index. Past performance does not guarantee future results.

Scatterplot showing monthly returns for gold on the y-axis and monthly S&P returns on the X-axis, emphasizing the second quadrant where gold returns are positive and S&P returns are negative.


3. A surge in industrial demand, coupled with relatively low liquidity, has fueled the rise of silver.

Silver demand has reflected a more balanced mix of investment and industrial usage. About 60% of annual silver consumption is tied to electronics, solar panels and semiconductors. Electronics alone account for roughly 445 million ounces of silver demand per year, making it the largest industrial use of the metal.8 The ongoing buildout of data centers, rising power demand from AI workloads, and broader electrification trends add a potentially cyclical and growth-sensitive component to silver. (Learn more about AI and energy in our 2026 Thematic Outlook.)

Where do precious metals go from here?

Forecasting prices for precious metals can be a notoriously tricky business, given they have no cashflows or future earnings to discount. As a result, prices tend to be purely a function of supply and demand. With supply of precious metals finite, we focus on changes in the demand landscape as the primary drivers of performance.

From that vantage point, we believe the outlook continues to look constructive. From a macroeconomic lens, falling real rates make precious metals’ lack of cashflows less costly, a potentially supportive backdrop for further allocations. And even after the remarkable returns of 2025, we expect that many of the demand drivers that drove precious metals will remain in place. In fact, we may still be in the early stages of a wave of demand from new sources such as central banks, stable coin issuers and the AI buildout — though rallies of 2025’s magnitude are rarely repeated.

Central bank gold purchases have reshaped the demand landscape for the metal. Accelerating after Russia’s invasion of Ukraine, demand for non-dollar reserve assets has been on the rise, particularly in emerging market and non-aligned economies. Central banks, which hold 20% of all mined gold, increased their gold reserves steadily from 2022–25 to diversify away from the U.S. dollar.9 Last year, gold overtook U.S. Treasuries as the largest share of global reserves for the first time in 30 years.

Central bank demand appears to show no signs of slowing: a 2025 survey showed that 95% of central banks expect global gold reserves to rise in 2026, up from 81% in 2024 and 52% in 2021.10 With economies like China and Brazil still holding less than 10% of their reserves in gold, central bank buying has the potential to remain a key support driver.

Figure 2: Central banks remain strong purchasers of gold

Stacked bar chart showing annual purchases of gold in tonnes by central banks.

Source: World Gold Council. Central bank gold purchases by year. As of January 28, 2026.

Stacked bar chart showing annual purchases of gold in tonnes by central banks, split by Q1-3 and Q4, with the 10-year average plotted as a dotted line for reference.


Private wealth allocations to gold are about 50% below levels seen a decade ago, potentially suggesting room for incremental demand.11 Over the past several years, India and China together have accounted for almost 60% of global consumer gold demand, while North America and Europe combined have represented only about 15%, suggesting Western households may have room to add.12 That under-allocation is also evident in portfolios. Gold ETPs make up only about 0.17% of U.S. private financial assets and remain below prior peaks seen in the early 2010s.13

New gold buyers are also emerging, including stablecoin issuers. Tether, the world’s largest stablecoin issuer, has accumulated roughly 140 tons of gold, equivalent to the 33rd-largest gold reserve globally.14 Stablecoins represent one of the fastest growing corners of the digital currency universe, having grown from $28 billion in 2020 to over $280 billion in 2025.15

Predictions for the further growth of stablecoins range from $1.9 trillion by 2030 for the base case to as much as $4 trillion under the bull scenario. Further growth in stablecoins has the potential to lead to further demand for gold via two channels: i) Issuers like Tether choosing to further diversify some of their dollar dependence by holding more gold alongside bitcoin and U.S. Treasuries; or ii) if investors start to migrate towards a greater preference for tokenized gold / “gold stablecoins” as an alternative to U.S. dollar stablecoins.

Flows also highlight how incremental demand is being expressed. Gold ETPs now hold more than 4,000 metric tons globally, with holdings rising by roughly 25% in 2025 to over $650 billion in assets.16

Figure 3: Commodity linked assets have had a lower correlation to equities

Scatter plot showing precious metals, miners, commodity index, AGG, and S&P.

Source: BlackRock; Morningstar. As of December 31, 2025. Data from January 2024 to December 2025. Bloomberg U.S. Aggregate Bond index represented by the iShares Core U.S. Aggregate Bond ETF (AGG); S&P 500 Index represented by the iShares Core S&P 500 ETF (IVV); broad commodities represented by the iShares Bloomberg Roll Select Commodity Strategy ETF (CMDY); gold represented by the iShares Gold Trust (IAU); silver represented by the iShares Silver Trust (SLV); gold miners represented by the iShares MSCI Global Gold Miners ETF (RING); silver miners represented by the iShares MSCI Global Silver Miners ETF (SLVP); and copper miners represented by the iShares MSCI Global Copper Miners ETF (ICOP).The performance quoted represents past performance and does not guarantee future results. Investment return and principal value of an investment will fluctuate so that an investor’s shares, when sold or redeemed, may be worth more or less than the original cost. Current performance may be lower or higher than the performance quoted. Performance data current to the most recent month end may be obtained by visiting the products' respective overview pages.

Scatter plot showing precious metals, miners, broad commodities, AGG, and S&P with annualized return on the Y-axis and correlation to the S&P on the X-axis. 


What role can gold and silver play in a portfolio?

In today’s markets, we believe gold and silver are not simply defensive assets. Together in a portfolio, they can offer differentiated exposures: gold as a strategic diversifier and store of value, and silver as a higher-volatility metal with meaningful industrial demand. As we wrote about in our 2026 Investment Directions, this means precious metals can serve both as portfolio differentiator and as a way to diversify within secular growth trends.

Gold and silver can play complementary roles in portfolios.

  • Gold has historically functioned as a strategic ballast, particularly during equity market drawdowns, exhibiting low or even negative correlation to equities when diversification matters most. We believe this has made gold one of the most consistent diversifiers during periods of market stress, and a critical portfolio tool in a time where stock-bond correlations have proven unreliable.
  • Silver has been more volatile and cyclical. While it has not consistently provided the same benefits as gold, silver can help enhance diversification over full market cycles by offering greater upside potential during periods of economic expansion, reflation, and industrial growth.17 Given its higher volatility, the sizing of a silver position within a portfolio has often been smaller than that for gold.18

How to invest in gold and silver with ETPs

There are many reasons to consider a tactical allocation to precious metals, which can help diversify traditional portfolios. iShares commodity ETPs can provide potential alignment with investors' views on macroeconomic and geopolitical developments with liquidity benefits similar to trading a stock.

Whatever the rationale, investors looking for convenient, cost-effective access to physical gold may consider the following:

Featured funds

  • iShares ETFs are available to purchase through a brokerage account or with a financial advisor.

    Buy through your brokerage

    iShares funds are available through online brokerage firms. All iShares ETFs and ETPs trade commission free online through Fidelity.

    By clicking on the button below, you will leave BlackRock’s website.

    Buy now on Fidelity

    Contact your advisor

    Contact a financial professional to discuss how iShares ETFs and ETPs can fit in your investment portfolio.

    Carefully consider the Funds' investment objectives, risk factors, and charges and expenses before investing. This and other information can be found in the Funds' prospectuses or, if available, the summary prospectuses, which may be obtained by visiting the iShares ETF and BlackRock Fund prospectus pages. Read the prospectus carefully before investing. Investing involves risk, including possible loss of principal.

    Any links to third-party websites are provided for use at your own discretion. Each third party is solely responsible for the content presented and availability of its website. BlackRock does not control, monitor or maintain third-party websites, their content or the products/services they offer. Content may change without notice. When you leave BlackRock’s website and enter a third-party website, you will be subject to that site’s terms, policies and/or notices, including those related to privacy and security, as applicable. Please review those policies and notices on the third-party website.

    Before engaging Fidelity or any broker-dealer, you should evaluate the overall fees and charges of the firm as well as the services provided. Free commission offer applies to online purchases of select iShares ETFs in a Fidelity account. The sale of ETFs is subject to an activity assessment fee (from $0.01 to $0.03 per $1,000 of principal). For iShares ETFs, Fidelity receives compensation from the ETF sponsor and/or its affiliates in connection with an exclusive long-term marketing program that includes promotion of iShares ETFs and inclusion of iShares funds in certain Fidelity Brokerage Services platforms and investment programs. Please note, this security will not be marginable for 30 days from the settlement date, at which time it will automatically become eligible for margin collateral. Additional information about the sources, amounts, and terms of compensation can be found in the ETF’s prospectus and related documents. Fidelity may add or waive commissions on ETFs without prior notice.

    The Funds are distributed by BlackRock Investments, LLC (together with its affiliates, “BlackRock”).

    ©2024 BlackRock, Inc or its affiliates. All Rights Reserved. BLACKROCK, iSHARES, iBONDS, LIFEPATH, ALADDIN and the iShares Core Graphic are trademarks of BlackRock, Inc. or its affiliates. All other trademarks are those of their respective owners.

    iCRMH1124U/S-3985892

Photo of Kristy Akullian, CFA

Kristy Akullian, CFA

Head of iShares Investment Strategy

Jasmine Fan

Investment Strategist

Contributor

Annie Khanna

Investment Strategist

Contributor

Aaron Task

Content Specialist

Contributor