Updated: July 28, 2025
Bitcoin volatility guide: Trends & insights for investors
Jul 11, 2024 Commodity
Key takeaways
- Bitcoin has exhibited strong performance in the past decade, but its long-term uptrend has been accompanied by immense volatility and large drawdowns along the way.
- Bitcoin’s volatility remains elevated at 3.6 and 5.1 times that of gold and global equities, respectively.1 But bitcoin’s volatility has consistently declined alongside the industry’s maturation in recent years.
- While bitcoin’s volatility is high in absolute terms, it’s in the same realm as many familiar investments, like certain mega cap tech stocks such as Nvidia, Tesla, and Meta.
Investors considering a bitcoin allocation should take a measured approach that not only considers the potential upside that could come from investing in bitcoin, but also its volatility and risks. Small allocations, regular rebalancing, and dollar cost averaging may help smooth out the ride.
Decoding Bitcoin's volatility
Bitcoin has become a globally recognized asset since its emergence 16 years ago. Regarded as the first global digital payment method to gain broad global adoption2, Bitcoin is a global monetary instrument that can be transferred directly between two people anywhere in the world, in near real-time. From 2014 to 2024, bitcoin was the best performing asset and held the top annual spot eight of those 11 years. But bitcoin was also the worst-performing asset in the other three years, demonstrating both the highs and lows of this asset. Over that time period, bitcoin still averaged a 54% annualized return through these ups and downs, outperforming every major asset class by a wide margin.
Figure 1: Bitcoin has had periods of high performance and periods of significant drawdowns
| 2015 | 2016 | 2017 | 2018 | 2019 | 2020 | 2021 | 2022 | 2023 | 2024 | 2025 YTD | Cumulative return | Annualized return |
|---|---|---|---|---|---|---|---|---|---|---|---|---|
| BTC 36% | BTC 120% | BTC 1,375% | AGG 0% | BTC 95% | BTC 305% | BTC 60% | CMT 21% | BTC 157% | BTC 120% | Gold 26% | BTC 33,858% | BTC 74% |
| SPX 1% | HY 17% | EM 35% | Gold –2% | SPX 31% | Gold 25% | CMT 31% | Gold 0% | SPX 26% | Gold 27% | BTC 15% | SPX 264% | SPX 13% |
| AGG 1% | CMT 13% | SPX 22% | HY –3% | EM 20% | SPX 18% | SPX 29% | HY –11% | HY 13% | SPX 25% | EM 11% | Gold 114% | Gold 10% |
| HY –4% | SPX 12% | Gold 14% | SPX –4% | Gold 18% | EM 15% | HY 5% | AGG –13% | Gold 13% | EM 12% | SPX 6% | EM 74% | EM 5% |
| Gold –10% | EM 11% | HY 8% | CMT –9% | HY 14% | AGG 8% | EM 1% | EM –18% | EM 10% | HY 8% | CMT 5% | HY 73% | HY 5% |
| EM –14% | Gold 8% | CMT 4% | EM –14% | CMT 10% | HY 7% | AGG –2% | SPX –18% | AGG 6% | CMT 8% | HY 5% | CMT 48% | CMT 4% |
| CMT –25% | AGG 3% | AGG 4% | BTC –74% | AGG 9% | CMT –3% | Gold –4% | BTC –64% | CMT –4% | AGG 1% | AGG 4% | AGG 19% | AGG 2% |
Source: Bloomberg and BIackRock calculations, as of June 30, 2025. Asset classes shown include major liquid asset classes available to U.S. investors. Bitcoin returns calculated using Bloomberg Bitcoin Spot Price. SPX is represented by the S&P 500 Index (TR). EM is represented by the Dow Jones Emerging Markets Index (TR). AGG is represented by Bloomberg U.S. Aggregate Bond Index (TR). HY is represented by Bloomberg U.S. Corporate High Yield Bond Index Value Unhedged (TR). Gold returns calculated using the spot exchange rate of gold against the U.S. dollar index. CMT is represented by Dow Jones Commodity Index (TR). All returns rounded to the nearest percent. Source: Bloomberg and BlackRock calculations, as of June 30, 2025.
Past performance does not guarantee future results. Index performance is for illustrative purposes only. Index performance does not reflect any management fees, transaction costs or expenses. Indexes are unmanaged and one cannot invest directly in an index Certain sectors and markets perform exceptionally well based on current market conditions and iShares and BIackRock Funds can benefit from that performance. Achieving such exceptional returns involves the risk of volatility and investors should not expect that such results will be repeated. Index performance does not represent actual Fund performance. For actual fund performance, please visit www.ishares.com or www.blackrock.com.
Bitcoin’s volatility — meaning its tendency to have big swings both up and down — as well as its frequent and prolonged drawdowns present risks and challenges to many investors. Since 2014, bitcoin has experienced four drawdowns in excess of 50%. While one of these was followed by a quick, six-month recovery, the three largest drawdowns averaged an approximately 80% decline. Patient investors were ultimately rewarded in each case, but in three of the four major corrections, bitcoin’s price took nearly three years to recover.
Figure 2: Bitcoin’s history of big drawdowns and rebounds
| Drawdown starts | Days until market bottom | Days until market recovery | Drawdown | 4yr forward return |
|---|---|---|---|---|
| December 19, 2017 | 360 | 1071 | –83% | 172% |
| January 7, 2014 | 372 | 1085 | –80% | 1,072% |
| November 10, 2021 | 376 | 849 | –77% | – |
| April 16, 2021 | 95 | 186 | –53% | – |
| September 5, 2021 | 9 | 37 | –31% | 844% |
| January 5, 2017 | 6 | 47 | –28% | 3,080% |
| March 7, 2017 | 17 | 49 | –25% | 4,359% |
| June 7, 2017 | 37 | 54 | –25% | 1,171% |
| January 11, 2021 | 16 | 28 | –23% | – |
| February 22, 2021 | 4 | 16 | –18% | – |
Source: Bloomberg XBTUSD Currency. Drawdowns calculated from daily returns. 4Yr Forward Return calculates the cumulative total return if bitcoin was held four years beginning at the start of each drawdown. Dashes in the 4Yr Forward Return column indicate that four years have not yet passed since the beginning of that drawdown. Past performance is not indicative of future results.
With a history of such extreme outcomes, relatively small allocations to bitcoin and regular rebalancing may help investors stay the course throughout market stress. And while past performance is no guarantee of future returns, it is important to recognize that bitcoin may continue to exhibit volatility in the future.
Bitcoin's volatility then & now
Bitcoin only came online 16 years ago. Such nascency breeds price volatility as market participants speculate about the role bitcoin may play in the global economy and in portfolios. This is similar to how a newly formed company is typically perceived as a riskier investment than a firmly established one.
But as time has passed and bitcoin has continued to solidify its global presence, its volatility has notably declined. While bitcoin is still much more volatile than other major asset classes, like equities and bonds, Figure 3 illustrates the steady decline in the volatility of the world’s largest digital asset3.
Figure 3: Bitcoin’s volatility vs. certain mega cap tech stocks
Rolling 1-year volatility
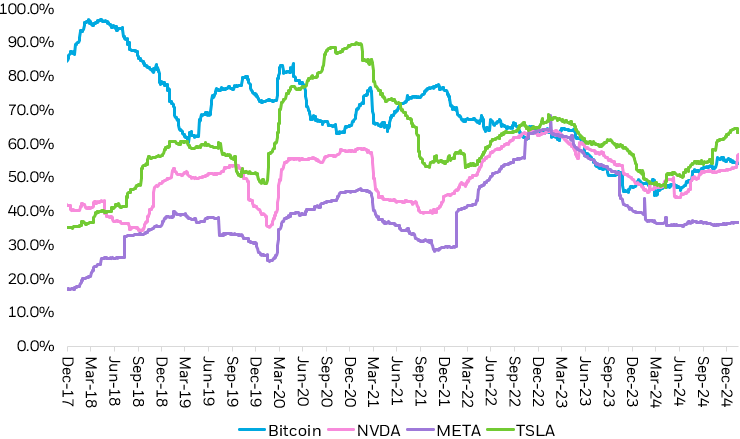
Source: Bloomberg. Bitcoin represented by Bloomberg Bitcoin Spot Price volatility Annualized using daily returns. For illustrative purposes only. Not meant to guarantee any future result or experience. Any companies mentioned do not necessarily represent current or future holdings of any BlackRock products. For actual Fund holdings, please visit www.ishares.com.
Chart description: Line chart showing the rolling 1-year volatility of Bitcoin juxtaposed with select mega cap companies: NVDA (NVIDIA Corporation), META (Meta Platforms Inc.), and TSLA (Tesla Inc.), showing a convergence in volatility levels over time from December 2017 to December 2024.
And while bitcoin is often associated with its immense volatility, it’s actually not an outlier when compared to certain mega cap tech stocks, like Nvidia, Tesla, and Meta, for example.
Figure 4: Bitcoin’s volatility is still high, but coming down
Rolling 1-year volatility
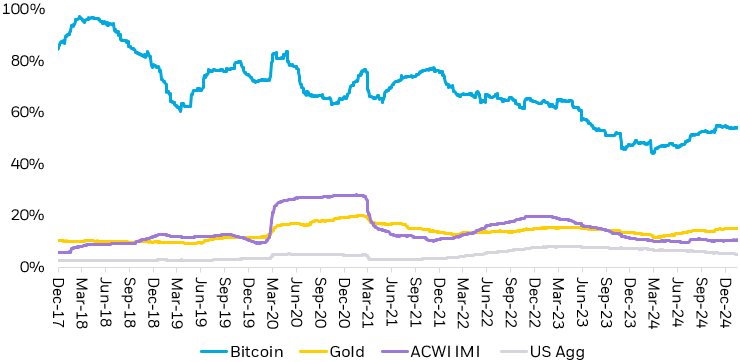
Source: Bloomberg. Bitcoin represented by Bloomberg Bitcoin Spot Price, Gold represented by Bloomberg Gold Spot Price, ACWI IMI represented by the MSCI ACWI IMI Net Total Return USD Index, US Agg represented by Bloomberg US Agg Total Return Value Unhedged USD Index. Volatility Annualized using daily returns. For illustrative purposes only. Not meant to guarantee any future result or experience.
Chart description: Line chart depicting the rolling 1-year volatility of Bitcoin alongside gold, global equities, and U.S. bonds, illustrating Bitcoin's historically high but decreasing volatility relative to other major asset classes from December 2017 to December 2024.
Bitcoin's volatility and overall portfolio risk
Arguably more important than bitcoin’s standalone volatility is the impact it will have on a portfolio’s overall volatility. Because bitcoin has been relatively uncorrelated to traditional assets like stocks and bonds over long time horizons, the way that it has behaved in a portfolio is unique. In fact, a bitcoin allocation may actually have a smaller impact on portfolio volatility than similar-sized positions in certain individual stocks. With large allocations, bitcoin’s standalone volatility can have an outsized impact on portfolio risk. But at more modest sizes, bitcoin’s typically low correlation has tended to provide modest diversifying effects while tapping into a novel source of return.
Still, investors must be aware of bitcoin’s immense volatility and should be prepared to weather long and potentially painful drawdowns. That’s why we believe anyone considering investing in bitcoin should understand their time horizon, risk tolerance, and have clear investment objectives. Investors can also navigate near-term volatility by using common portfolio management methods such as dollar cost averaging, regular rebalancing, and maintaining a long-term investment horizon.

Featured funds
The iShares Bitcoin Trust ETF is not an investment company registered under the Investment Company Act of 1940, and therefore is not subject to the same regulatory requirements as mutual funds or ETFs registered under the Investment Company Act of 1940.
