Updated: November 3, 2025
How active ETFs may help enhance portfolio performance
Aug 21, 2024 Fixed Income
Key takeaways
- Active ETFs are funds that are actively managed by professionals to target outcomes beyond the tracking of an index, such as outperforming an index, generating income, or accessing a broader universe — including asset classes that aren’t as accessible in traditional indices.
- BlackRock projects that global active ETF assets under management will triple to $4.2 trillion by 2030, from $1.4 trillion as of June 2025.1
- The iShares Flexible Income Active ETF (BINC) is an example of an active ETF, and is managed by an experienced team led by Rick Rieder, BlackRock’s Chief Investment Officer of Global Fixed Income.
History of the ETF
The Exchange-Traded Fund (ETF) industry has dramatically transformed in the past 30 years, progressively growing in both assets under management and in the variety of ETFs available to investors. From just a handful of U.S.-based funds in 1993 to over 15,000 globally today, ETFs have evolved to provide access to a broad range of asset classes, sectors, and geographies.2
The vast majority of ETFs seek to track an index — commonly known as index funds. With ETFs becoming a wrapper of choice — expanding from 15% of total fund assets in 2013 to 30% in 20253 — investors increasingly want the same low-cost, efficient wrapper to pursue differentiated, alpha-seeking strategies, or to gain unique exposures. Enter Active ETFs.
What is an active ETF?
Active ETFs are investment funds managed by professional portfolio managers who actively select and adjust the fund’s holdings in an effort to outperform the market, deliver a specific outcome, or gain exposure to hard-to-index markets. This involves ongoing analysis and decision-making based on market conditions.
What are the differences between active and index ETFs?
Whereas index ETFs seek to replicate the performance of an underlying index, like the S&P 500, active ETFs seek to achieve a specific outcome, such as outperforming an index or generating income, via the ability of managers to make adjustments to the portfolio to take advantage of the best opportunities and/or consider a broader investment universe to achieve differentiated outcomes.
Active ETFs by the numbers
We believe the asset management industry is at an inflection point, where active ETFs are poised to become an increasingly important part of investor toolkits, alongside mutual funds, closed-end funds, separately managed accounts, and index ETFs.
Consider the following:
- Active ETFs accounted for 88% of all U.S.-listed ETF launches through June 2025, and 51% of global ETF launches.4
- Active ETFs comprised 29% of global ETF net asset inflows and organic asset growth through June 2025, up from 20% the prior year.5
Figure 1: Global active ETF net asset inflows (USD billions, %), 2013-2025
Active ETFs are comprising a larger share of industry net asset inflows
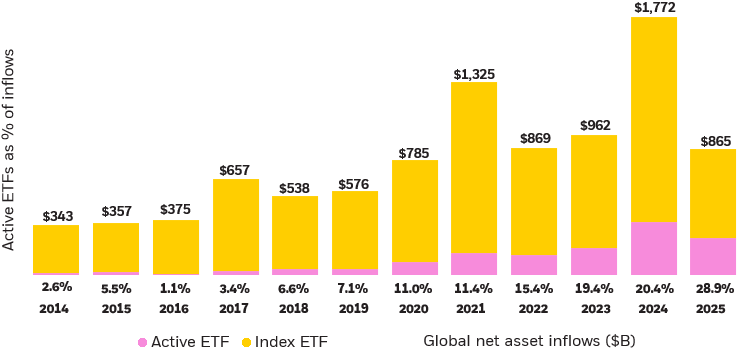
Source: ETF groupings determined by BlackRock Global Business Intelligence as of June 2025. Numbers for 2025 are through June.
Chart description: Bar chart depicting the growth of active ETFs as a percent of the overall ETF industry’s net asset inflows.
- Individual investors have increased their exposures to active ETFs, going from $9 billion AUM in 2019 to $55.9 billion through March 2024.
Figure 2: U.S. active ETF assets under management by individual investors (USD billions), 2016-2025
Individual investors are increasing their use of active ETFs
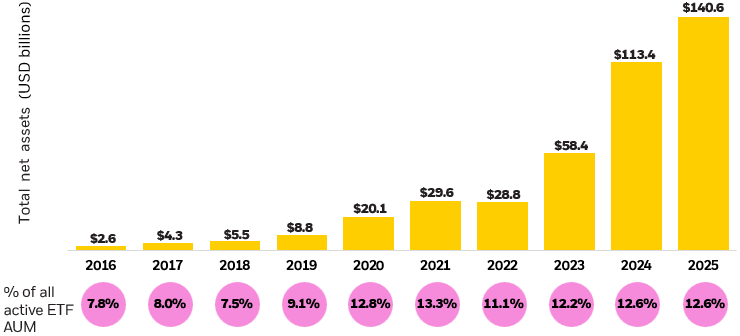
Source: Broadridge Global Market Intelligence as of May 30, 2025. Numbers for 2025 go through May. Measures total net assets invested in active ETFs across discount platforms (inferred to mean individual investors, who are the only ones to have access to those platforms) through year-end of each year.
Chart description: Bar chart depicting how individual investors are allocating more of their assets into active ETFs.
- BlackRock projects that global active ETF assets under management will triple to $4.2 trillion by 2030, from $1.4 trillion as of June 2025.6
Figure 3: We expect global active ETF assets to reach $4T by 2030
Actual and projected growth of active ETFs (USD billions)
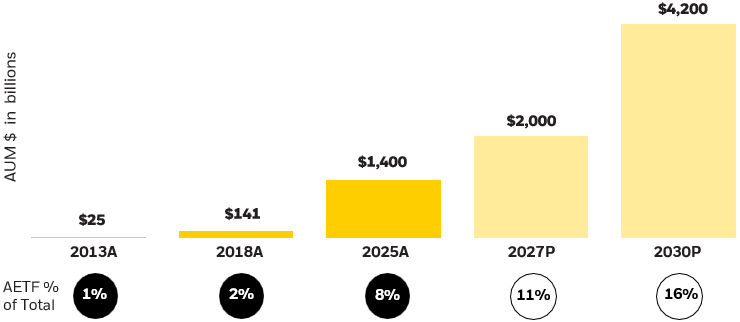
Source: BlackRock, as of June 30, 2025. The 2025 number is actual through the first half of the year. Estimates are for global figures and include 2027 and 2030 scenario calculations based on proprietary research by BlackRock Global Product Solutions. Subject to change. The figures are for illustrative purposes only and there is no guarantee the projections will come to pass.
Chart description: Bar chart depicting actual and projected growth of global active ETFs.
Meet BINC, the iShares flexible income active ETF
The iShares Flexible Income Active ETF (BINC) is an example of an active ETF that seeks to outperform an index, also known as alpha-seeking. Launched in May 2023, BINC seeks to offer investors access to sectors of the fixed income market that can be challenging to reach, including European credit, high yield, and securitized products.
The ETF is managed by an experienced team led by Rick Rieder, BlackRock’s Chief Investment Officer of Global Fixed Income and Head of the Global Allocation Investment Team. He serves on numerous management committees and is Chairman of the firm-wide BlackRock Investment Council. Over an investment career of more than 37 years, Rick Rieder has served as Vice Chairman and member of the Borrowing Committee for the U.S. Treasury and member of the Federal Reserve’s Investment Advisory Committee on Financial Markets.
His skilled management of several funds has resulted in being awarded the 2023 Outstanding Portfolio Manager by Morningstar7, the Global Unconstrained Fixed Income Manager of the Year for 2015 by Institutional Investor8, and he was inducted into the Fixed Income Analysts Society Fixed income Hall of Fame in 2013. Four of the five funds Rick Rieder manages — Strategic Income Opportunities Fund (BSIIX), Total Return Fund (MAHQX), Strategic Global Bond Fund (MAWIX), and Global Allocation Fund (MALOX) — have been awarded Gold Medals by Morningstar.9 (See figure 4)
Finally, Rick serves as Chairman and President of the Board of Education for North Star Academy's fourteen Charter Schools in Newark, New Jersey. He is a member of the board of Emory University, Emory's Goizueta Business School, and the University's Finance Committee, and is the Vice Chairman of the Investment Committee. He is founder and chairman of the Goizueta Business School's BBA investment fund and community financial literacy program, Graduation Generation Public School Collaboration in Atlanta. He is also on the Board of the BlackRock Foundation, the Board of Advisors for the Hospital for Special Surgery, and is a Member of the Ownership Group and Board of Advisors of the Baltimore Orioles.
What is BINC’s investment philosophy?
BINC focuses on utilizing “plus” fixed income sectors, beyond the traditional, well-known “core” markets, to seek income and manage risk through different market environments, which can make it complementary to core strategies. “Core” refers to the traditional fixed income asset classes with the highest credit quality, such as U.S. Treasuries, U.S. agency mortgages, and U.S. investment grade corporate debt. Conversely, "plus" refers to fixed income asset classes outside of the "core" universe, such as U.S. high yield corporate debt, securitized products, and global debt.
The fund has the ability to invest across the full extent of global fixed income opportunities in an effort to create a portfolio that generates “plus” income with less volatility.
Figure 4: Award-winning investing
Morningstar performance as of 9/30/25
| Morningstar category | Fund name | Ticker | Overall Morningstar rating¹⁰ | Morningstar analyst rating¹¹ | 1-yr | 3-yr | 5-yr | 10-yr | |
|---|---|---|---|---|---|---|---|---|---|
| Fixed income | Percentile rankings | ||||||||
| Nontraditional Bond | Strategic Income Opportunities Fund | BSIIX | ★★★★ | Analyst-driven %¹² 100% Data-coverage %¹² 100% | 27 | 38 | 42 | 39 | |
| Intermediate Core-Plus Bond | Total Return Fund | MAHQX | ★★★ | Analyst-driven %¹² 100% Data-coverage %¹² 100% | 42 | 57 | 68 | 52 | |
| Intermediate Core Bond | Core Bond Fund | BFMCX | ★★★ | Analyst-driven %¹² 55% Data-coverage %¹² 100% | 60 | 40 | 50 | 44 | |
| World Bond | Strategic Global Bond Fund | MAWIX | ★★★★ | Analyst-driven %¹² 100% Data-coverage %¹² 100% | 46 | 45 | 45 | 16 | |
| Multi-asset | Percentile rankings | ||||||||
| Global Allocation | Global Allocation Fund | MALOX | ★★★★ | Analyst-driven %¹² 100% Data-coverage %¹² 100% | 9 | 37 | 61 | 37 |

Source: Morningstar as of 9/30/2025. Rankings for all funds are for the Institutional share class. Performance for other share classes may vary. Rankings based on total return excluding sales charges, BlackRock Core Bond Fund : 1 Year 249/464; 3 Year 154/443; 5 Year 212/409; 10 Year 155/347. Morningstar has awarded the Fund a Silver medal (Effective 8/31/2025). BlackRock Strategic Income Opportunities Fund : 1 Year 85/247; 3 Year 96/240; 5 Year 86/225; 10 Year 63/182. Morningstar has awarded the Fund a Gold medal (Effective 2/11/2025). BlackRock Total Return Fund : 1 Year 206/554; 3 Year 278/531; 5 Year 294/489; 10 Year 207/412. Morningstar has awarded the Fund a Gold medal (Effective 11/19/2025). BlackRock Strategic Global Bond Fund : 1 Year 62/154; 3 Year 66/154; 5 Year 62/154; 10 Year 26/144. Morningstar has awarded the Fund a Gold medal (Effective 5/28/2025). BlackRock Global Allocation Fund : 1 Year 32/409; 3 Year 141/406; 5 Year 226/401; 10 Year 133/377. Morningstar has awarded the Fund a Gold medal (Effective 5/28/2025). Ratings based on risk-adjusted total return, determined monthly and subject to change. The Overall Morningstar Rating for a fund is derived from a weighted average of the performance figures associated with its 3-, 5-, and 10-year (if applicable) Morningstar Rating metrics. Performance data quoted represents past performance and does not guarantee future results. See important notes for additional information.
For many years, fixed income was used as a tool to pair with equities. Traditional indices of choice for this implementation, such as the Bloomberg Barclays US Aggregate Index, are often concentrated, with high interest rate risk and high volatility.13 In a 40-year bull market that saw the 10-year Treasury yield fall from over 15% to under 1%,14 this worked well-enough as persistently falling interest rates meant price appreciation for investors. Today, however, we find ourselves in a new regime as rates have broken out of their 40-year bull market. With Treasury yields higher and showing more two-way risk, duration, volatility, and correlation between stocks and bond15 representing potential downside risks — especially as the U.S. Government continues to issue more and more debt.
In this environment, we believe fixed income allocations may benefit from a focus on optimizing income while minimizing unnecessary volatility. In BINC, we believe in leveraging the 21st century portfolio construction tools such as regime identification16, stress testing, scenario analysis, and risk modeling to pursue this optimal balance of income and volatility.
BINC is, by definition, a “plus” sector product because it has a 20% limit on its combined exposure to traditional fixed income assets, U.S. Treasuries, agency mortgages, and U.S. investment grade debt.17 This limit is in place so that investors know they are receiving exposure to true “plus” fixed income sectors vs. traditional core bonds. In addition to the 20% limit on core bonds, BINC’s prospectus also mandates18 :
- A 15% limit on collateralized loan obligations (CLOs).
- A 15% limit on preferred securities.
- A 15% limit on bank loans.
- A duration between 1-5 years (learn more about duration, which is a measure of a bond’s price sensitivity to changes in interest rates.)
Within those confines, the fund seeks to target differentiated sources of yield and allocates across different sectors — all while managing both interest rate volatility and credit risk.
This is where the expertise of the fund’s managers, as well as BlackRock’s global footprint, comes into play. Using the full scope of the BlackRock Global fixed income platform, BINC combines top-down asset allocation decisions with bottoms-up security selection to channel both worlds towards one clear objective.
The potential advantages of BINC
This multi-faceted active management style could be advantageous for BINC. There are nearly 70,000 distinct fixed income securities in the vast, nuanced fixed income universe. Thorough top-down regime identification and cross-asset analysis allow portfolio managers to look across the universe in an effort to identify an optimal combination of allocations to pursue the fund’s income objective most efficiently. This process involves myriad decisions that are made in parallel, including, but not limited to:
- Where on the yield curve to hold interest rate exposure, reflecting how comfortable the managers are with each maturity.
- Which tranche of credit is offering the greatest risk/return.
- How much exposure to have in each region.
- How much interest-rate risk to take.
From there, specialists in each asset class contribute their expertise to the security selection process — ensuring every security is expertly analyzed and intentionally selected.
In “plus” markets like European Credit or CLOs, having specialized research teams dedicated to finding the best opportunities are essential for generating durable alpha and managing risk within each asset class. Without having direct access to a robust and global platform of experts and proprietary data, like BlackRock’s, investors would have a very difficult time replicating the underlying strategy and process.
The dispersion within the high yield asset class today illustrates the importance of this active approach. In the current environment, U.S. high-yield triple-C rated securities face significant vulnerabilities as they grapple with the difficulties of refinancing in a high-rate environment; meanwhile, U.S. high-yield double-Bs have seen historically low defaults but spreads here are at historic tights19 — meaning compensation to investors for owning these bonds is lower than it has been for a long time. The situation in both these segments highlights the need for an elevated thoughtfulness on both total exposure and security selection — and this is just the U.S. high yield market.
Across the pond, European credit markets still offer higher spreads than the U.S. markets, which makes an allocation here compelling for both picking-up yield and diversification. However, slower economic growth in Europe creates an added risk for the lowest-quality lenders there. For this reason, our teams currently prefer to stay in the higher-quality segments of European high yield.
Altogether, one can easily see how active asset allocation and security selection is important when seeking the most optimal, efficient combination of credit quality, convexity, and income when looking across a universe of nearly 70,000 securities.
Most individuals — even many professionals — simply don’t have the time, resources, and expertise to construct and continually maintain a “plus” fixed income portfolio. That’s why BINC was launched and why we believe it can be a great complement to a traditional core bond allocation, which you can buy more or less of based on your risk appetite.
As illustrated in Figure 5, BINC has produced strong returns since inception with less volatility and lower peak-to-through drawdowns relative to funds that invest in either a broad universe of U.S. dollar-denominated bonds or high-yield corporate bonds.
Figure 5: BINC performance since inception
BINC’s realized performance, volatility, and drawdown numbers illustrate BINC’s historical value-add in a portfolio
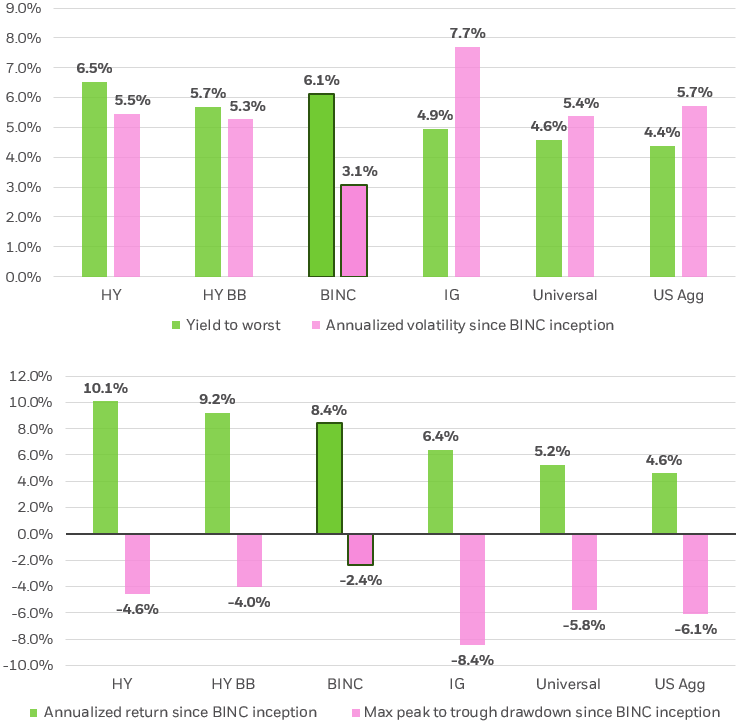
Source: Bloomberg, BlackRock, as of 10/6/2025.
HY uses iShares iBoxx $ High Yield Corporate Bond ETF (HYG), HY BB uses iShares BB Rated Corporate Bond ETF (HYBB), IG uses iShares iBoxx $ Investment Grade Corporate Bond ETF (LQD), Universal uses iShares Core Universal USD Bond ETF (IUSB), Agg uses iShares Core U.S. Aggregate Bond ETF (AGG) peak to trough drawdown defined as largest move down in price over any period since 5/23/23 (BINC inception). *Performance data represents past performance and does not guarantee future results. Investment return and principal value will fluctuate with market conditions and may be lower or higher when you sell your shares. Current performance may differ from the performance shown. For most recent month-end performance, standardized performance, the SEC 30-day yield and a prospectus for each of these funds, click on the following tickers: HYG, HYBB, LQD, IUSB, AGG, BINC.
Chart description: Table showing how BINC has produced strong returns since inception with less volatility and lower peak-to-through drawdowns compared to funds that invest in either a broad universe of U.S. dollar-denominated bonds or high-yield corporate bonds.
5 potential benefits of active ETFs for investors
We believe active ETFs have earned a place in portfolios by helping investors to access more strategies and differentiated returns through the convenience of the ETF wrapper. Active management broadens the investment universe and increases flexibility, which enables managers and funds with strong records of performance to create diversified portfolios and capture more opportunities for alpha.
Increased market volatility and uncertainty are leading to greater stock market dispersion, resulting in greater differences in performance across companies, sectors, geographies, and asset classes. The greater the dispersion, the greater the potential for managers to generate returns above benchmarks, known as alpha.20
Select active ETFs can offer investors access to markets that are not easily made into an index. In fixed income, for example, active managers can create diversified portfolios that take advantage of better relative value opportunities in hard-to-reach asset classes with less interest rate risk and lower volatility.
Portfolio managers of active ETFs can incorporate proprietary research and react in real-time to evolving market conditions. This gives managers freedom to respond to market inflection points as they seek to outperform benchmarks, target certain investment outcomes, or react to a changing market.
Because ETFs trade like stocks during market hours on exchanges, investors can buy or sell any time the market is open. In addition to this liquidity and ease of trading, another advantage of ETFs is their potential for tax efficiency as compared to other structures. Because of their unique structure, there are two distinct ways in which ETFs can be more tax efficient than other investment vehicles.
First, investors buy and sell ETF shares on an exchange – transacting with other investors. As a result, the ETF manager doesn't have to sell holdings — potentially creating realized capital gains for remaining investors — to meet investor redemptions.
Second, the in-kind creation and redemption process means that the ETF manager may have the opportunity to deliver assets that would otherwise have been sold in a portfolio rebalance, limiting the number of taxable events that occur within the fund.
What are the different types of active ETFs?
We see three distinct categories within active ETFs: alpha-seeking, outcomes, and exposures.
Figure 6: 3 Categories of Active ETFs
| {{EMPTY}} | {{EMPTY}} |
|---|---|
| 1. Alpha-seeking Strategies that seek to outperform a benchmark based on proprietary research and insights. | Alpha strategies seek to outperform a benchmark based on proprietary research and insights. These include both fundamental and systematic strategies, such as:
|
| 2. Outcomes Strategies that deliver targeted investment objectives combining or modifying market exposures via the use of derivatives or portfolio construction. | Options-based strategies offer targeted investment objectives combining or modifying market exposures via the use of derivatives or portfolio construction, including:
|
| 3. Exposures Strategies that deliver access to segments of the market that are difficult to index. | Non-index strategies feature access to segments of the market that are difficult to index, such as cash or commodities Derivative-based exposures, including leveraged, inverse and single stock products |
Investment comparisons are for illustrative purposes only. To better understand the similarities and differences between investments, including investment objectives, risks, fees and expenses, it is important to read the products’ prospectuses.
Any asset class can be managed within alpha-seeking, outcome, and exposure ETFs. Outcomes strategies replicate defined outcomes previously only available in vehicles such as structured notes, which can be opaque, costly, and difficult for individual investors to access. Meanwhile, alpha-seeking strategies are often similar to those previously delivered in mutual funds. Exposures can offer investors access to markets that are not easily investible via indexing.
Putting active ETFs into action
- To learn more about Active ETFs, visit our Active ETF strategy page.
- To explore BINC, visit The iShares Flexible Income Active ETF (BINC) product page.
- To view all iShares Active ETFs, visit our pre-filtered Fund Screener tool.

