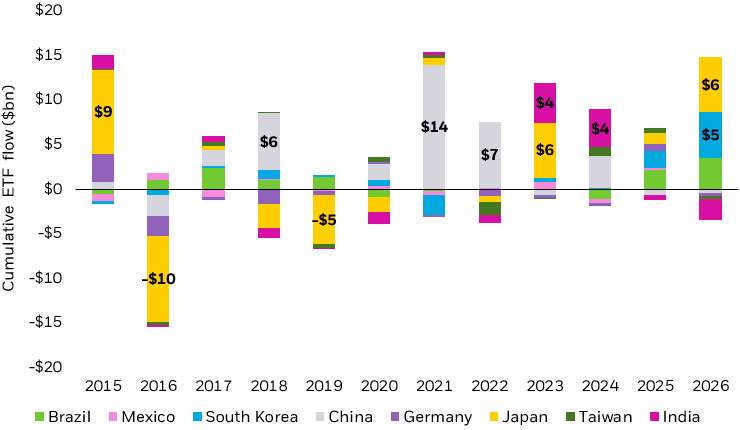
International stocks: Getting tactical and targeted in 2026

Key takeaways

  • Demand for international stocks in 2026 has been strong. But investors are increasingly becoming more selective in their global exposures, balancing structural conviction with a more cautious near-term backdrop.
  • Our preference is for emerging markets vs. developed economies. Early 2026 flows showed strong demand for emerging markets and single-country ETFs, which in just a few weeks exceeded total inflows for all of 2025, though more recent data suggests a moderation in flows amid geopolitical uncertainty.
  • Investors looking to add international stocks to a diversified portfolio may consider broad exposures such as the iShares Core MSCI Total International Stock ETF (IXUS), regional exposures such as the iShares Core MSCI Emerging Markets ETF (IEMG) or single country exposures such as the iShares MSCI South Korea ETF (EWY).
IXUS

iShares Core MSCI Total International Stock ETF

Seek exposure to growth and diversification opportunities outside of the U.S.

IEMG

iShares Core MSCI Emerging Markets ETF

Get low cost, comprehensive access to stocks in emerging markets.

EWY

iShares MSCI South Korea ETF

Access companies in South Korea, which plays a central role in AI infrastructure and semiconductor manufacturing.

Why are international stocks in focus?

If 2025 was the year many investors “rediscovered” international stocks, 2026 is shaping up to be a year to be more precise in global exposures.

Fund flows suggest market participants are seeking more tailored and targeted opportunities within the broad asset class of international equities this year, as discussed in our 2026 Year Ahead Investment Directions.

In the first eight weeks of 2026, investors added $32 billion to U.S.-listed emerging market equity ETFs with single-country ETFs recording exceptional demand, led by South Korea and Brazil. Notably, year-to-date flows into single-country ETFs have already exceeded the total inflows for all of 2025, underscoring the intensity and conviction behind the trade.

Stacked bar chart of cumulative ETF flows by country from 2015–2026 shows high volatility, with large inflows in 2015, 2021, 2023, and 2026, and a sharp outflow in 2016.

Source: Bloomberg, as of Feb. 27, 2026. ETF groupings determined by Markit.

Image Description: Stacked bar chart showing cumulative ETF flows (in billions of dollars) by country from 2015 to 2026. Each bar represents a year, with segments for Brazil, Mexico, South Korea, China, Germany, Japan, Taiwan, and India. Values above zero indicate inflows; below zero indicate outflows.


Flows are volatile over time. A strong inflow appears in 2015, followed by a sharp outflow in 2016, driven largely by Japan. From 2017 to 2020, flows are mixed and relatively modest.


Inflows increase again in 2021, led primarily by China, and remain positive in 2022. Strong inflows continue in 2023 and 2024, with notable contributions from Japan and India. After a smaller positive year in 2025, inflows rise again to start 2026, led by South Korea and Japan.


Overall, the chart shows cyclical ETF flows from 2015 to 2025, followed by a sharp spike in early 2026.


Is now a good time to invest in international stocks?

Despite uncertainty about conflict in the Middle East , our client client conversations continue to indicate robust demand for emerging market (EM) tech through broad Asia exposures and single country funds such as Korea and Taiwan. Demand remains particularly strong among non-U.S. investors, who continue to seek to repatriate investments away from the U.S. and back to home equity markets.

For U.S. investors, particularly those overweight domestic equities, looking abroad can offer the twin benefits of lower valuations and increased diversification. A rangebound U.S. dollar further adds to the favorable backdrop.

Home country bias is a perennial theme among U.S. investor portfolios. The average advisor is overweight U.S. equities, with allocations continually increasing over the past decade. Our analysis of more than 20,000 portfolios showed that, on average, advisors allocate as much as 75% of their stock sleeves to U.S. companies — compared to a 63% weighting in a benchmark like the MSCI All Country World Index.1

Our most recent Americas client polling indicates international equities are now the most common “top add” advisors are considering over the next three months, cited by 28% of clients, up from ~15% in December 2025.2

At the same time, planned reductions to international have collapsed: Less than 8% of clients plan to reduce international exposures, down from 13.6% in November.3

Which regions look attractive? EM Asia stands out

When placing a greater emphasis on selectivity within international exposures, investors may consider countries and regions with credible earnings growth, improving macro fundamentals, and diversification benefits relative to portfolios that have become heavily concentrated in U.S. growth and AI-centric equities. 

We see selective opportunities in developed market defense and industrial sectors but have a regional preference for emerging markets at the moment. Propelled by shifting geographic allocations and exposure to essential infrastructure needed for the AI buildout, emerging markets have seen strong earnings growth and returns in 2026, though some of this strength has partially reversed amid recent market volatility and a stronger U.S. dollar.4

EM stocks are up 43% in the last 12 months and, historically, periods of EM stock outperformance cluster together.5

Emerging market stocks following periods of large outperformance/underperformance

Average annual returns, rolling 12 months since 1995

Bar chart showing that performance trends persist: after emerging markets outperform U.S. stocks by over 20%, they continue to lead by about 4.7% the next year; after underperforming by over 20%, they lag by about 8.1%.

Source: Morningstar and BlackRock as of 1/31/26. U.S. stocks represented by the S&P 500 index. Emerging market stocks represented by the Morningstar diversified emerging markets category. This illustration assumes reinvestment of dividends and capital gains. Assumes investor stays fully invested over the full time period. Index performance is for illustrative purposes only. Past performance does not guarantee or indicate future results. It is not possible to invest in an index.


Image description: This chart compares the average 12-month returns of emerging market (EM) stocks versus U.S. stocks following periods of extreme relative performance since 1995. It presents two scenarios based on prior EM performance relative to U.S. stocks.


When emerging markets have outperformed U.S. stocks by more than 20%, they have outperformed in the following year. On average, EM stocks exceeded U.S. stock returns by approximately 4.7% over the next 12 months.


When emerging markets have underperformed U.S. stocks by more than 20%, the trend has persisted but in the opposite direction. In the subsequent year, EM stocks lagged behind U.S. stocks by approximately 8.1%, meaning U.S. stocks  have outperformed.


Overall, the chart illustrates a historical pattern of performance persistence: strong relative performance—whether positive or negative—has tended to continue into the following year rather than reverse.


Within EM, we see the strongest opportunities in Asia, where we maintain strong structural conviction given the region’s central role in the global AI buildout, despite near-term macro-driven volatility.

While U.S. tech leadership is anchored in model development, chip design, cloud platforms, and enterprise software, Asia’s leadership is tied to semiconductor manufacturing, energy infrastructure and cost-efficient model deployment. Therefore, EM Asia offers a unique opportunity for investors to diversify away from concentration in U.S. mega-caps while still gaining access to the key beneficiaries of the next global AI buildout cycle. While this structural AI-driven opportunity set remains firmly in place, we expect the path forward to be uneven, with volatility driven by factors such as geopolitical uncertainty, dollar strength, and energy prices.

We named South Korea our highest conviction equity market exposure in our 2026 outlook and continue to believe structural tailwinds remain firmly in place, while acknowledging potential near-term volatility. We believe S. Korea plays a central role in global AI infrastructure and semiconductor manufacturing, and has ongoing corporate governance reforms aimed at improving shareholder returns.

Our preference for S. Korea is supported by positive sentiment, earnings momentum, and upward earnings revisions, while trading at a roughly 14% discount to its 5-year average P/E.6

Investors interested in getting targeted access to South Korean equities may consider the iShares MSCI South Korea ETF (EWY), whose top holdings include memory chip players such as Samsung and SK Hynix as well as Hyundai Motor and KB Financial Group.7

Many large EM Asian economies are significant oil importers and therefore more exposed to energy price increases and a stronger U.S. dollar, particularly if recent conflict in the Middle East proves long-lasting or expands. While the longer-term structural case for EM remains intact, near-term caution is warranted until there is greater clarity on the trajectory of the conflict and energy prices.

In addition to Asia, Latin America is emerging as a key beneficiary of the global surge in AI spending, primarily through its dominant position in key commodity exports. Acceleration in AI infrastructure buildout such as data centers and power grids requires substantial amounts of industrial metals such as copper, which may benefit not only Latin American mining companies, but also driving increased investment into the region. Investors interested in getting exposure to Latin American equities may consider the iShares Latin America 40 ETF (ILF).

How can ETFs simplify global investing?

By providing liquidity, tax efficiency, and potential diversification benefits, ETFs help make it easier to invest across a variety of assets. Given the breadth and depth of the global economy, and the potential challenges of selecting individual stocks in foreign markets, these benefits may be especially helpful for investing in international stocks.

International stocks are re-emerging as a strategic allocation within global investing portfolios, supported by a strong long-term backdrop but with more near-term volatility. While U.S. markets remain central to global capital flows, international equities may offer both fundamental opportunities and diversification benefits in 2026.

U.S. investors interested in adding to global exposures may consider:

  • The iShares Core MSCI Total International Stock ETF (IXUS), which provides exposure to a broad range of international developed and emerging market companies.
  • The iShares Core MSCI Emerging Markets ETF (IEMG), which provides low cost, comprehensive access to stocks in a broad range of emerging market countries.
  • Investors specifically interested in accessing international dividend payers may consider the iShares International Dividend Growth ETF (IGRO), which invests in companies from more than 30 countries worldwide with a history of growing their dividends.

FAQs

International stocks are shares of companies headquartered outside the United States and traded on foreign exchanges.

International stocks have historically offered diversification benefits relative to concentrated U.S. portfolios. While an overweight position in U.S. large caps has paid off over the last 15 years, concentration risk is a potential concern. U.S. equity index returns are increasingly beholden to a relatively small list of mega-cap constituents, potentially making portfolios riskier overall.8

International markets often have different drivers of risk and return than U.S. ones. One way to quantify these differences is by factor breakdown. The U.S. has long benefitted from its inherent growth tilt, while both developed and emerging markets often exhibit higher exposure to the value factor, with higher dividend and earnings yields than their U.S. counterparts.9 By incorporating international equities into a diversified portfolio, investors may benefit from structural geopolitical or thematic forces, while also offsetting some of the inherent growth bias within their U.S. equity sleeves.

A weaker U.S. dollar may enhance returns for U.S. investors holding international stocks by boosting foreign currency translation gains. A weaker dollar has historically been associated with strong international equity performance because a weaker dollar means more purchasing power for local consumers around the world.10 Emerging market economies with dollar-denominated debt have typically benefitted most from a weaker U.S. dollar.

We believe Emerging markets may benefit from improving macro conditions, technology leadership in Asia, and easing dollar pressures. But near-term caution is warranted until there is greater clarity on the trajectory of the Middle East conflict and energy prices.

Featured funds

Photo of Kristy Akullian, CFA

Kristy Akullian, CFA

Head of iShares Investment Strategy

Jasmine Fan

Investment Strategist

Contributor

Jon Angel

Investment Strategist

Contributor

Aaron Task

Content Specialist

Contributor