-
To address climate change, many of the world's major countries have signed the Paris Agreement. The temperature goal of the Paris Agreement is to limit global warming to well below 2°C above pre-industrial levels, and ideally 1.5 °C, which will help us avoid the most severe impacts of climate change.
What is the ITR metric?
The ITR metric is used to provide an indication of alignment to the temperature goal of the Paris Agreement for a company or a portfolio. ITR employs open source 1.55° C decarbonization pathways derived from the Network of Central Banks and Supervisors for Greening the Financial System (NGFS). These pathways can be regional and sector specific and set a net zero target of 2050, in line with GFANZ (Glasgow Financial Alliance for Net Zero) industry standards. We make use of this feature for all GHG scopes. This enhanced ITR model was implemented by MSCI on February 19, 2024.
How is the ITR metric calculated?
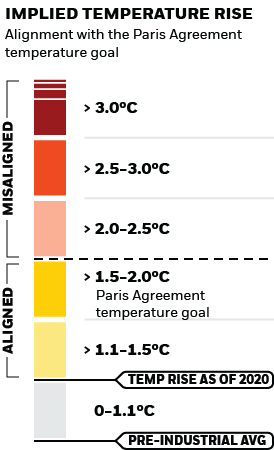
The ITR metric is calculated by looking at the current emissions intensity of companies within the fund's portfolio as well as the potential for those companies to reduce its emissions over time. If emissions in the global economy followed the same trend as the emissions of companies within the fund's portfolio, global temperatures would ultimately rise within this band.
Note, only corporate issuers are covered within the calculation. A summary explanation of MSCI’s methodology and assumptions for its ITR metric can be found here.
Because the ITR metric is calculated in part by considering the potential for a company within the fund’s portfolio to reduce its emissions over time, it is forward-looking and prone to limitations. As a result, BlackRock publishes MSCI’s ITR metric for its funds in temperature range bands. The bands help to underscore the underlying uncertainty in the calculations and the variability of the metric.
What are the key assumptions and limitations of the ITR metric?
This forward-looking metric is calculated based on a model, which is dependent upon multiple assumptions. Also, there are limitations with the data inputs to the model. Importantly, an ITR metric may vary meaningfully across data providers for a variety of reasons due to methodological choices (e.g., differences in time horizons, the scope(s) of emissions included and portfolio aggregation calculations).
There is not a universally accepted way to calculate an ITR. There is not a universally agreed upon set of inputs for the calculation. At present, availability of input data varies across asset classes and markets. To the extent that data becomes more readily available and more accurate over time, we expect that ITR metric methodologies will evolve and may result in different outputs. Funds may change bands as methodologies evolve. Where data is not available, and / or if data changes, the estimation methods vary, particularly those related to a company’s future emissions.
The ITR metric estimates a fund’s alignment with the Paris Agreement temperature goal based on a credibility assessment of stated decarbonization targets. However, there is no guarantee that these estimates will be reached. The ITR metric is not a real time estimate and may change over time, therefore it is prone to variance and may not always reflect a current estimate.
The ITR metric is not an indication or estimate of a fund’s performance or risk. Investors should not rely on this metric when making an investment decision and instead should refer to a fund’s prospectus and governing documents. This estimate and the associated information is not intended as a recommendation to invest in any fund, nor is it intended to indicate any correlation between a fund’s ITR metric and its future investment performance.