
SUSA
iShares MSCI USA ESG Select ETF
-
Fees as stated in the prospectus
Expense Ratio: 0.25%
Overview

Performance
Performance
Growth of Hypothetical $10,000
Distributions
| Record Date | Ex-Date | Payable Date |
|---|
Premium/Discount
-
Returns
| 1y | 3y | 5y | 10y | Incept. | |
|---|---|---|---|---|---|
| Total Return (%) | 21.47 | 6.98 | 14.57 | 12.17 | 9.70 |
| Market Price (%) | 21.62 | 6.99 | 14.60 | 12.17 | 9.70 |
| Benchmark (%) | 21.69 | 7.22 | 14.85 | 12.55 | 10.16 |
| After Tax Pre-Liq. (%) | 21.08 | 6.64 | 14.20 | 11.79 | 9.37 |
| After Tax Post-Liq. (%) | 12.93 | 5.34 | 11.65 | 10.04 | 8.29 |
| YTD | 1m | 3m | 6m | 1y | 3y | 5y | 10y | Incept. | |
|---|---|---|---|---|---|---|---|---|---|
| Total Return (%) | 12.31 | 3.12 | 3.00 | 12.31 | 21.47 | 22.43 | 97.44 | 215.32 | 504.42 |
| Market Price (%) | 12.40 | 3.09 | 3.17 | 12.40 | 21.62 | 22.48 | 97.63 | 215.40 | 504.74 |
| Benchmark (%) | 12.45 | 3.14 | 3.07 | 12.45 | 21.69 | 23.25 | 99.81 | 226.24 | 555.58 |
| After Tax Pre-Liq. (%) | 12.17 | 3.06 | 2.94 | 12.17 | 21.08 | 21.26 | 94.23 | 204.70 | 470.36 |
| After Tax Post-Liq. (%) | 7.39 | 1.88 | 1.82 | 7.39 | 12.93 | 16.90 | 73.52 | 160.36 | 370.05 |
| 2019 | 2020 | 2021 | 2022 | 2023 | |
|---|---|---|---|---|---|
| Total Return (%) | 32.18 | 24.64 | 30.31 | -21.31 | 23.87 |
| Market Price (%) | 32.09 | 24.62 | 30.45 | -21.38 | 23.89 |
| Benchmark (%) | 32.56 | 24.96 | 30.64 | -21.12 | 24.08 |
Key Facts
Key Facts
Portfolio Characteristics
Portfolio Characteristics
Sustainability Characteristics
Sustainability Characteristics
Sustainability Characteristics provide investors with specific non-traditional metrics. Alongside other metrics and information, these enable investors to evaluate funds on certain environmental, social and governance characteristics. Sustainability Characteristics do not provide an indication of current or future performance nor do they represent the potential risk and reward profile of a fund. They are provided for transparency and for information purposes only. Sustainability Characteristics should not be considered solely or in isolation, but instead are one type of information that investors may wish to consider when assessing a fund. Learn more
This fund seeks to follow a sustainable, impact or ESG investment strategy, as disclosed in its prospectus. For more information regarding the fund's investment strategy, please see the fund's prospectus.
Review the MSCI methodologies behind Sustainability Characteristics using the links below.
What is the Implied Temperature Rise (ITR) metric? Learn what the metric means, how it is calculated, and about the assumptions and limitations for this forward-looking climate-related metric.
To address climate change, many of the world's major countries have signed the Paris Agreement. The temperature goal of the Paris Agreement is to limit global warming to well below 2°C above pre-industrial levels, and ideally 1.5 °C, which will help us avoid the most severe impacts of climate change.
What is the ITR metric?
The ITR metric is used to provide an indication of alignment to the temperature goal of the Paris Agreement for a company or a portfolio. ITR employs open source 1.55° C decarbonization pathways derived from the Network of Central Banks and Supervisors for Greening the Financial System (NGFS). These pathways can be regional and sector specific and set a net zero target of 2050, in line with GFANZ (Glasgow Financial Alliance for Net Zero) industry standards. We make use of this feature for all GHG scopes. This enhanced ITR model was implemented by MSCI on February 19, 2024.
How is the ITR metric calculated?
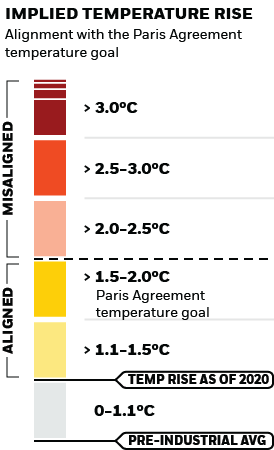
The ITR metric is calculated by looking at the current emissions intensity of companies within the fund's portfolio as well as the potential for those companies to reduce its emissions over time. If emissions in the global economy followed the same trend as the emissions of companies within the fund's portfolio, global temperatures would ultimately rise within this band.
Note, only corporate issuers are covered within the calculation. A summary explanation of MSCI’s methodology and assumptions for its ITR metric can be found here.
Because the ITR metric is calculated in part by considering the potential for a company within the fund’s portfolio to reduce its emissions over time, it is forward-looking and prone to limitations. As a result, BlackRock publishes MSCI’s ITR metric for its funds in temperature range bands. The bands help to underscore the underlying uncertainty in the calculations and the variability of the metric.
What are the key assumptions and limitations of the ITR metric?
This forward-looking metric is calculated based on a model, which is dependent upon multiple assumptions. Also, there are limitations with the data inputs to the model. Importantly, an ITR metric may vary meaningfully across data providers for a variety of reasons due to methodological choices (e.g., differences in time horizons, the scope(s) of emissions included and portfolio aggregation calculations).
There is not a universally accepted way to calculate an ITR. There is not a universally agreed upon set of inputs for the calculation. At present, availability of input data varies across asset classes and markets. To the extent that data becomes more readily available and more accurate over time, we expect that ITR metric methodologies will evolve and may result in different outputs. Funds may change bands as methodologies evolve. Where data is not available, and / or if data changes, the estimation methods vary, particularly those related to a company’s future emissions.
The ITR metric estimates a fund’s alignment with the Paris Agreement temperature goal based on a credibility assessment of stated decarbonization targets. However, there is no guarantee that these estimates will be reached. The ITR metric is not a real time estimate and may change over time, therefore it is prone to variance and may not always reflect a current estimate.
The ITR metric is not an indication or estimate of a fund’s performance or risk. Investors should not rely on this metric when making an investment decision and instead should refer to a fund’s prospectus and governing documents. This estimate and the associated information is not intended as a recommendation to invest in any fund, nor is it intended to indicate any correlation between a fund’s ITR metric and its future investment performance.
To be included in MSCI ESG Fund Ratings, 65% (or 50% for bond funds and money market funds) of the fund’s gross weight must come from securities with ESG coverage by MSCI ESG Research (certain cash positions and other asset types deemed not relevant for ESG analysis by MSCI are removed prior to calculating a fund’s gross weight; the absolute values of short positions are included but treated as uncovered), the fund’s holdings date must be less than one year old, and the fund must have at least ten securities.
Business Involvement
Business Involvement
Business Involvement metrics can help investors gain a more comprehensive view of specific activities in which a fund may be exposed through its investments.
Business Involvement metrics are not indicative of a fund’s investment objective, and, unless otherwise stated in fund documentation and included within a fund’s investment objective, do not change a fund’s investment objective or constrain the fund’s investable universe. For more information regarding a fund's investment strategy, please see the fund's prospectus.
Review the MSCI methodology behind the Business Involvement metrics, using links below.
Business Involvement metrics are calculated by BlackRock using data from MSCI ESG Research which provides a profile of each company’s specific business involvement. BlackRock leverages this data to provide a summed up view across holdings and translates it to a fund's market value exposure to the listed Business Involvement areas above.
Business Involvement metrics are designed only to identify companies where MSCI has conducted research and identified as having involvement in the covered activity. As a result, it is possible there is additional involvement in these covered activities where MSCI does not have coverage. This information should not be used to produce comprehensive lists of companies without involvement. Business Involvement metrics are only displayed if at least 1% of the fund’s gross weight includes securities covered by MSCI ESG Research.
Fees
Fees
| Management Fee | 0.25% |
| Acquired Fund Fees and Expenses | 0.00% |
| Other Expenses | 0.00% |
| Expense Ratio | 0.25% |
The amounts shown above are as of the current prospectus, but may not include extraordinary expenses incurred by the Fund over the past fiscal year. Amounts are rounded to the nearest basis point, which in some cases may be "0.00".
Ratings
Ratings
Morningstar Medalist Rating

Holdings
Holdings
| Ticker | Name | Sector | Asset Class | Market Value | Weight (%) | Notional Value | Shares | CUSIP | ISIN | SEDOL | Price | Location | Exchange | Currency | FX Rate | Accrual Date |
|---|
The values shown for “market value,” “weight,” and “notional value” (the “calculated values”) are based off of a price provided by a third-party pricing vendor for the portfolio holding and do not reflect the impact of systematic fair valuation (“the vendor price”). The vendor price is not necessarily the price at which the Fund values the portfolio holding for the purposes of determining its net asset value (the “valuation price”). Holdings data shown reflects the investment book of record, which may differ from the accounting book of record used for the purposes of determining the Net Assets of the Fund. Additionally, where applicable, foreign currency exchange rates with respect to the portfolio holdings denominated in non-U.S. currencies for the valuation price will be generally determined as of the close of business on the New York Stock Exchange, whereas for the vendor price will be generally determined as of 4 p.m. London. The calculated values may have been different if the valuation price were to have been used to calculate such values. The vendor price is as of the most recent date for which a price is available and may not necessarily be as of the date shown above.
Please see the “Determination of Net Asset Value” section of each Fund’s prospectus for additional information on the Fund’s valuation policies and procedures.
READY TO INVEST?
READY TO INVEST?
There are many ways to access iShares ETFs. Learn how you can add them to your portfolio.