- Exchange traded funds (ETFs) remain a fraction of the total global financial market in both equities and fixed income, ranging from 4.6%-13% of equities and 0.4%-2.8% of fixed income assets by region.1
- While global ETF volumes increased in Q4 2023 from the prior quarter, full-year levels were lower than the record levels reached in 2022. Bid-asked spreads widened in Q4 from Q3, but full-year levels were tighter than the previous year.2
- Individual investors, particularly in the U.S., continued to participate in the ETF market, including in ETF options, with trading activity particularly elevated in active and complex products.3
Global ETF Market Facts: three things to know from Q4 2023
Jan 17, 2024 Global
THREE THINGS TO KNOW FROM Q4 2023
ETF MARKET SIZE
Assets under management in ETFs are only a fraction of the global financial market.
ETFs represent 13% of equity assets in the U.S., 8.8% in Europe, and 4.6% in Asia-Pacific. Market share is smaller in fixed income, where ETFs account for 2.8% of fixed income assets in the U.S., 1.9% in Europe, and 0.4% in Asia-Pacific (Figures 1, 2, and 3).
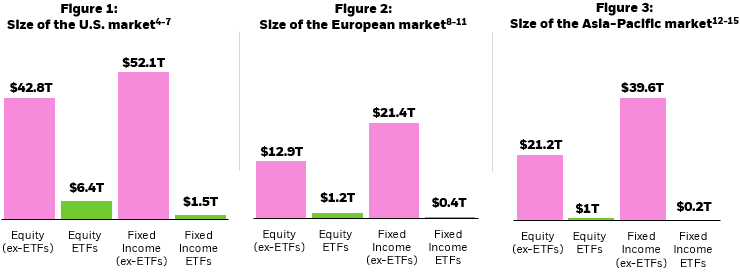
Chart description: Column charts showing the size of equity and fixed incomes ETF assets under management in comparison to the total equity market capitalization and total debt outstanding in the U.S., Europe, and Asia-Pacific. This chart shows that while ETFs represent a large dollar amount of assets, that amount is still small in comparison to both the equity and fixed income markets.
ETF TRADING VOLUMES
In the fourth quarter of 2023, average daily trading volumes for the U.S. equity market (shares, ETFs, and depository receipts) and U.S. ETFs were $539.2 billion and $165.7 billion, respectively. This means that U.S. ETFs accounted for 30.7% of the total U.S. composite volume in the secondary market over the quarter, higher than the Q3 figure.
In Europe, there was also an uptick in this percentage. Average daily trading volume in European equities was $80.7 billion, while the average daily trading volume in European ETFs was $10.9 billion — 13.5% of total European equities over the quarter. This was a result of an increase in European ETF volumes in Q4.
In Asia-Pacific, ETFs accounted for 13.9% of the total composite volume in the secondary market in the quarter, with Asia-Pacific equities and ETFs trading $137.1 billion and $19.1 billion, respectively. This was a decrease from Q3, led by a drop-off in Korean ETF trading ($2.2 billion vs $3.5 billion) and a slight increase in Asia-Pacific equity volumes (Figures 4, 5, and 6).
Figures 4, 5, and 6: ETFs as a percentage of total equity trading volume (% average)16
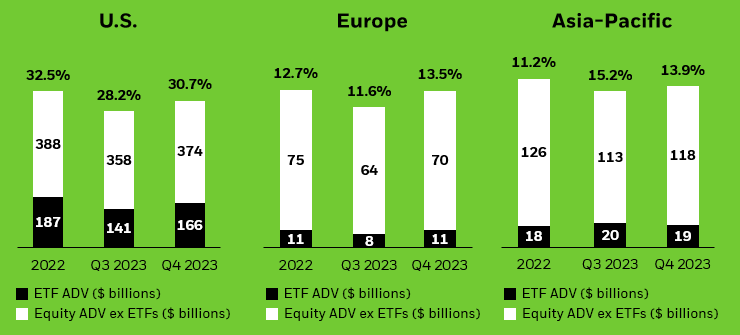
Chart description: Column charts showing ETF trading as a percentage of overall equity market trading volumes in the U.S., Europe, and Asia-Pacific. Equity ADV includes stock and ETF volumes. This chart shows that ETF trading volume as a percentage of the equity trading volume was higher in the U.S. and Europe, but lower in Asia-Pacific than in the previous quarter.
MOST TRADING ACTIVITY OCCURS IN THE SECONDARY MARKET
Most ETF trading activity occurs in the secondary market, where ETF shares change hands between buyers and sellers. When demand cannot be met in the secondary market, large institutions (known as “authorized participants”) can transact with ETF issuers to create or redeem ETF shares in a separate, “primary” market.
In the fourth quarter of 2023, the ratio of secondary market activity to primary market activity in the U.S. was 8:1. This means that for every $8 of ETFs traded, only $1 resulted in trading activity in the underlying securities. In Europe, this ratio was 2:1 and in Asia-Pacific it was nearly 5:1 (Figures 7, 8, and 9).
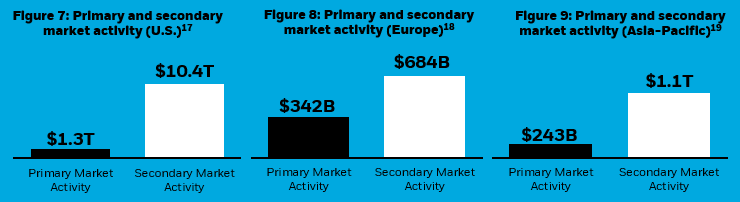
Chart description: Column chart showing the amount of ETF trading in the secondary market compared to the amount of primary market activity in the U.S., Europe, and Asia-Pacific. The amount of secondary market activity is far greater than primary activity, which means that most ETF trading takes place on an exchange between buyers and sellers and does not impact the underlying securities of the ETF.
iSHARES SECONDARY MARKET TRADING STATS
In the fourth quarter of 2023, the average daily trading volume in U.S. iShares ETFs was $43.8 billion, up from an average of $33.8 billion in Q3 2023.
In Europe, the average daily trading volume in iShares ETFs was $4.9 billion, up from an average of $4 billion in Q3 2023.
In Asia-Pacific, the average daily trading volume in iShares ETFs was $0.13 billion, in line with the Q3 2023 average (Figure 10).
Figure 10: Average daily volumes for iShares ETFs20
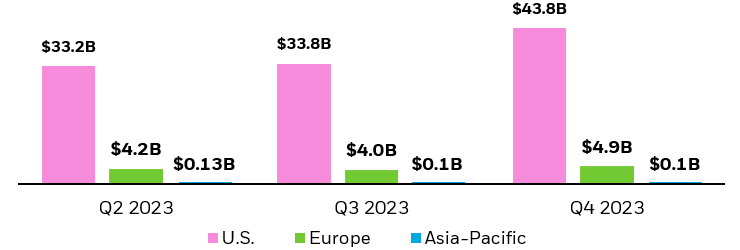
Chart description: Column chart showing the average daily volume (ADV) of iShares ETF trading in the U.S., Europe, and Asia-Pacific in Q4 2023. Volumes slightly increased quarter-over-quarter in the U.S. and Europe and remained roughly in line Asia-Pacific.
Bid-ask spreads (a component of trading costs for investors), are impacted by factors such as liquidity, volatility, and the efficiency of the ETF ecosystem.
In Q4, bid-ask spreads in U.S. iShares ETFs slightly widened to 12 basis points (bps), on average. In European-listed iShares ETFs, spreads slightly widened to 12.6 bps on average, and in Asia-Pacific-listed iShares ETFs, spreads widened to 19.3 bps on average (Figure 11).
Figure 11: Average iShares ETF bid-ask spreads (bps)21
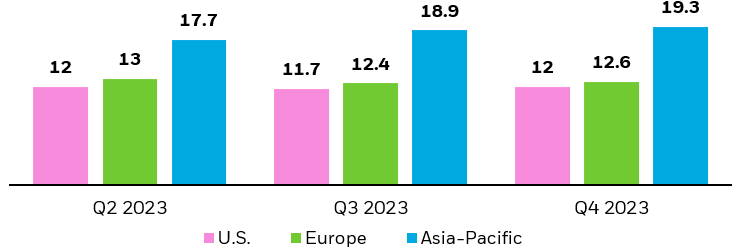
Chart description: Column chart showing the average bid-ask spread (a component of an ETF’s trading cost) for iShares ETFs in the U.S., Europe, and Asia-Pacific for Q4 2023. Bid-ask spreads widened in all three regions compared with Q3 2023.
ETF FLOWS TYPICALLY HAVE MINIMAL IMPACT ON STOCKS
Investors can assess the impact of primary market activity on the prices of underlying stocks through a metric called “imputed flow.” This metric estimates the proportion of all stock trading that results from ETF creations or redemptions; meaning, imputed flow is an approximation for how much stock trading is generated by ETF inflows and outflows.
The impact is typically modest. From December 2021 through December 2023, approximately 5.2% of trading volume in U.S. equities has been attributable to ETF activity, while in Europe, just 2% of trading in individual European stocks has been attributable to ETF flows. In Asia-Pacific, this figure is 1.4% (Figures 12, 13, and 14).
Figures 12–14: Percentage of stock trading as a result of ETF flows22
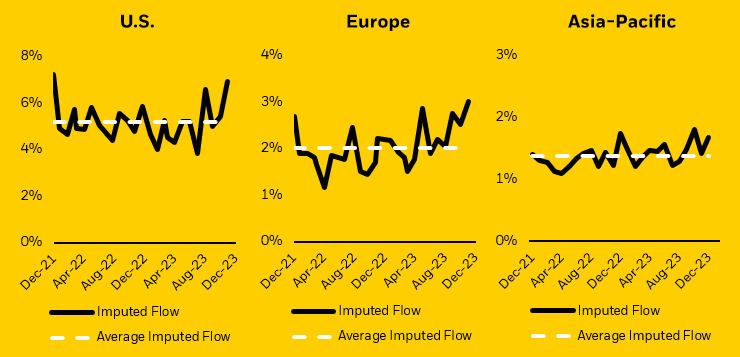
Chart description: Line charts showing both the total and average imputed flow in the U.S., Europe, and Asia-Pacific. Imputed flow is an estimation of how stock trading is generated by ETF inflows and outflows. The charts show that imputed flow is below 5.2%, on average, in all regions.
A LOOK AT THE ETF LANDSCAPE IN 2023
- While global ETF volumes declined from record levels in 2022, fixed income volumes remained elevated.
- Bid-asked spreads tightened year-over-year as market volatility remained low, particularly in the second half of the year.
- Individual investors, particularly in the U.S., continued to participate in the ETF market, including in ETF options, with elevated trading in certain market segments, like actively managed ETFs.
INVESTORS CONTINUED TO TURN TO ETFs
While 2022 set the record for global ETF volumes with over $52 trillion traded, investors continued to transact at elevated levels in 2023 compared with prior years. Annual global ETF trading volumes reached nearly $45 trillion, the second most on record.23
Regionally, Asia-Pacific ETF volumes reached record levels in 2023 at nearly $4.6 trillion, offset by slight declines in volumes in the U.S. and Europe (Figure 15).
Figure 15: Volumes for globally-listed ETFs by region24
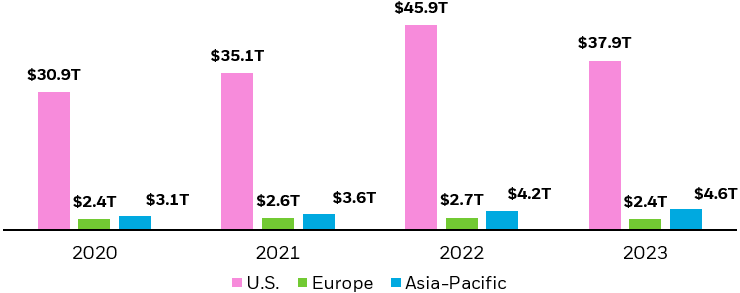
Chart description: Column chart showing total ETF volumes in the U.S., Europe, and Asia-Pacific in 2023 compared with prior years. Volumes declined in both the U.S. and Europe for 2023, but increased for Asia-Pacific. 2022 represented the highest year on record for total global ETF volumes.
At the asset class level, fixed income ETF trading activity remained elevated with global volumes nearly reaching their 2022 levels. However, a notable decline in equity ETF volumes ultimately drove volumes lower year-over-year (Figure 16).
Figure 16: Volumes for globally-listed ETFs by asset class25
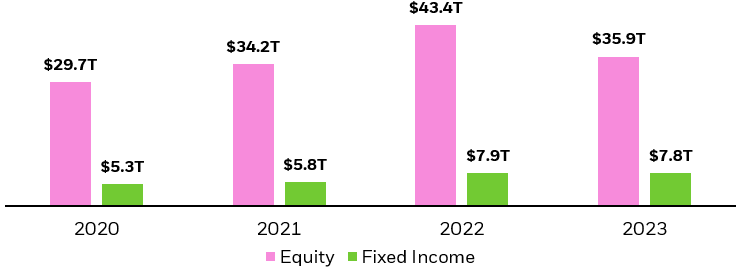
Chart description: Column chart showing total ETF volumes globally by asset class in 2023 compared with prior years. Volumes declined for both equity and fixed income ETFs globally in 2023, but there was a more pronounced decrease in equity ETFs.
ETF INVESTORS TRANSACTED AT LOW COST
Volatility, as measured by the VIX Index, which is a proxy for U.S. equity market volatility, had an average level of 16.9 in 2023, the lowest since 2019, and down from over 25 in 2022.26 This decrease in volatility likely led to a reduction in ETF trading costs.
In 2023, bid-ask spreads in globally-listed ETFs tightened to 25.6 basis points (bps), on average, compared with 27.7 bps 2022. At the same time, bid-ask spreads for globally-listed iShares ETFs tightened to 13.3 bps, on average, compared with 15.6 bps 2022 (Figure 17).
Figure 17: Average bid-ask spreads of globally-listed ETFs (bps) 27
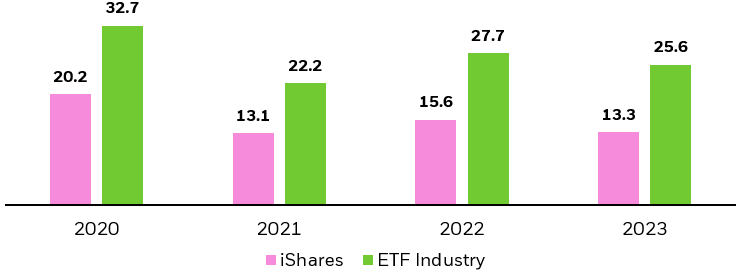
Chart description: Column chart showing the average bid-ask spread (a component of an ETF’s trading cost) for both iShares ETFs and the total ETF industry globally in 2023 compared with prior years. Bid-ask spreads tightened for both iShares and the total ETF industry globally in 2023, compared with 2022.
INDIVIDUAL INVESTORS KEPT TRADING ETFs
The number of individual investors — those who invest their own money to save for retirement or meet other financial goals — participating in financial markets has grown significantly in recent years.28 As a result, trading by individual investors in U.S.-listed ETFs has also increased, with trading volumes remaining elevated since 2019 (Figure 18).
We believe individual investors’ increased use of ETFs has been driven by a few key factors: an industry shift to commission-free trading, improved digital experiences on direct platforms, and investor empowerment stemming from greater access to financial education through social media and other forums.
Figure 18: Growth of individual investor trading volumes in U.S.-listed ETFs as of November 202329
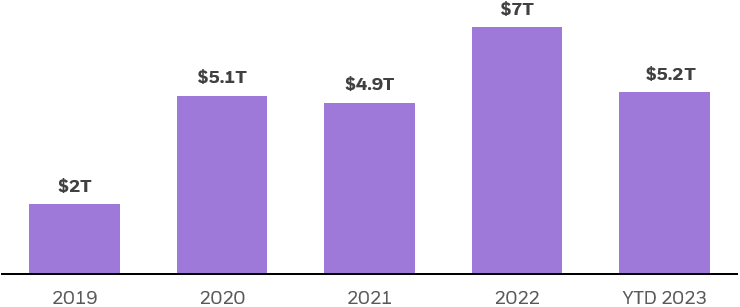
Chart Description: Bar chart showing the growth in yearly volumes of individual investor ETF trading, measured in $ trillions. ETF volume is calculated by multiplying the number of ETF shares traded by the price of each share.
U.S. INDIVIDUAL INVESTOR ETF ACTIVITY IN 2023
While individual investor ETF trading volumes are expected to be lower in 2023 versus 2022, it will still be the second highest year on record. There were some notable takeaways around individual investors’ use of ETFs in 2023:
- Individual investor ETF trading activity remained resilient. Individual investor trading activity in ETFs represented 15% of all ETF trading in 2023, in line with 2022.30
- Individual investors increased their use of iShares ETFs. Individual investor trading activity in iShares and BlackRock ETFs represented 17% of all individual investor ETF trading in 2023, up from 15% in 2022.31
- Individual investors continued to use actively managed ETFs. Individual investors accounted for over 30% of all actively managed ETF volumes in 2023, up from 24% in 2022.32
- Individual investors continued to trade ETF options. Individual investors drove 22% of all ETF options activity, a slightly lower percentage than in 2022 (but a greater total notional volume traded).33 Use of zero days to expiration (0DTE) options, which have become often-used investment tools among individual investors, continued over the period.34
INDIVIDUAL INVESTORS ARE UTILIZING ETFs GLOBALLY
Like in the U.S., a new generation of individual investors across Europe are increasingly investing in ETFs. A recent YouGov survey commissioned by BlackRock identified three key trends:35
- First-time investors. 6.6 million new individual investors could own ETFs across Europe in the next 12 months, bringing the total number of individual investors in the region to 27 million. Notably, countries with lowest ETF penetration offer the fastest growth potential.
- Younger demographic. Investors aged 18 to 34 will likely be the leading group of individual investors owning ETFs in Europe.
- ETF Savings Plans. The popularity of digital investment platforms could help propel further growth and adoption of ETF Savings Plans, which are forecasted to reach 20 million by 2026, up from 2 million in 2019.36
In Asia-Pacific, advocacy efforts to improve transparency and the trading experience for investors coupled with efforts to enhance investor access are helping to provide the groundwork for ETF adoption by individual investors. In certain countries, like Taiwan, individual investor usage of ETFs remained high, where over 99% of all ETF assets are from individual investors.37 In Japan, individual investor ownership increased 15% year-over-year and many Japanese individual investors are now gaining access to U.S.-listed ETFs via online brokerages.38
