Authorized participants by the numbers

Samara Cohen Aug 14, 2023 United States

INTRODUCTION

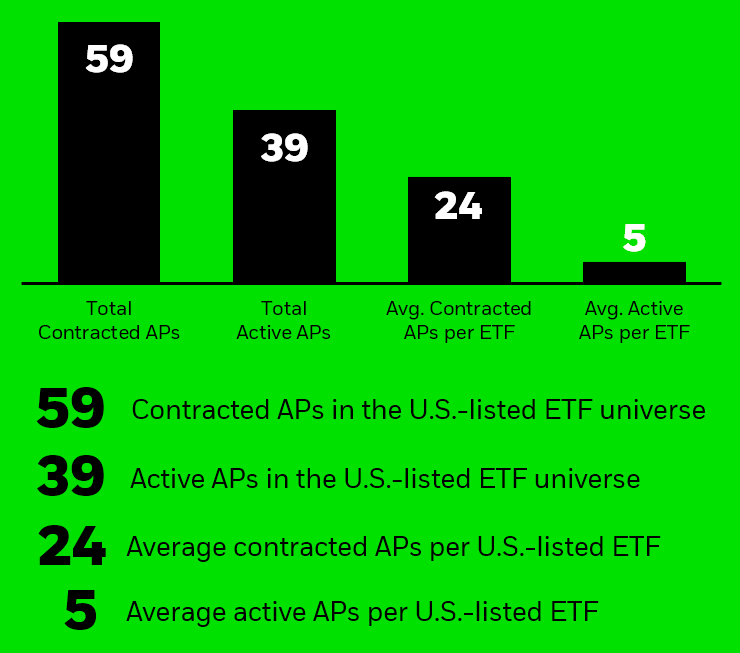
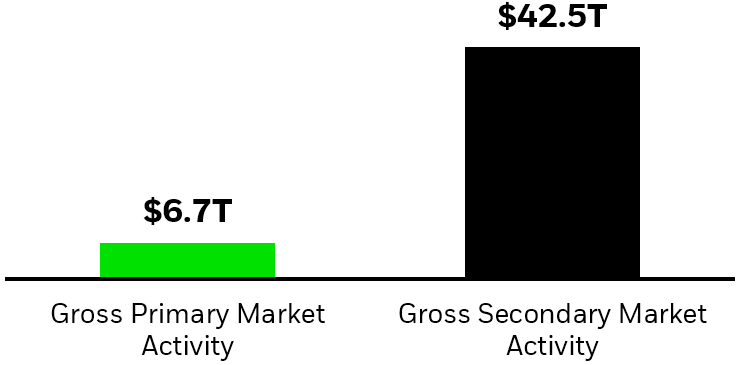
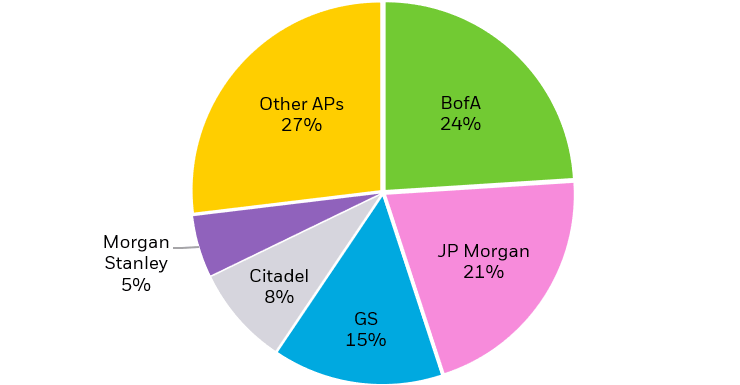
The rapid growth of exchange trade funds (ETFs) is supported by a robust, dynamic “ecosystem” made up of many players. Among the key contributors to smooth ETF operations are authorized participants (APs). These financial institutions work with ETF issuers to create and redeem shares in the primary market. To learn more about the role of authorized participants, see The authorized participant and market maker ecosystem.

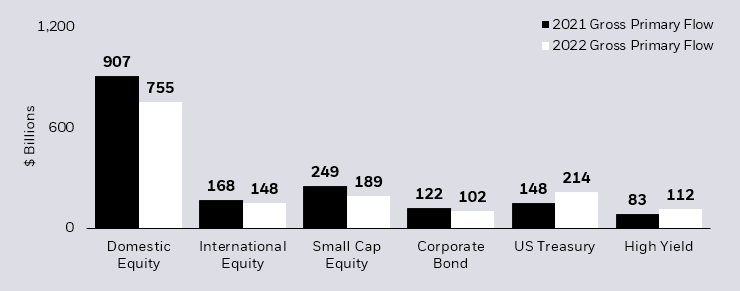
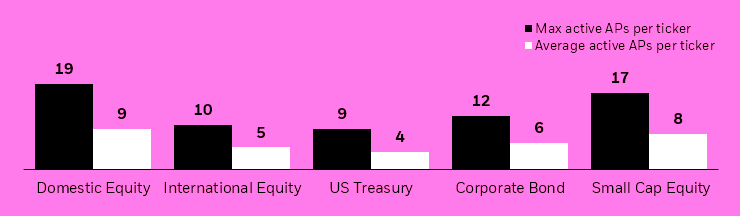
This paper looks deeper into the U.S. ETF ecosystem to analyze the breadth and scope of the AP universe. It draws on data disclosed by fund companies annually, as required by the U.S. Securities and Exchange Commission (SEC).1

A BROAD, DIVERSE UNIVERSE

Most ETFs are supported by numerous APs. On average, U.S.-listed ETFs have 24 “contracted” APs and five “active” APs (Figure 1). A contracted AP has an effective agreement in place with an ETF issuer, even if the AP does not regularly create or redeem ETF shares. An active AP has created or redeemed shares of an ETF within the fund’s most recent fiscal year.2

Not all APs are active at the same time. For example, some institutions may complete formal paperwork to become an AP so they can participate when it makes economic sense to do so. This presence of contracted APs helps ensure vibrant competition exists to provide ETF creation and redemption services. If an active AP were to step away, another contracted AP could step in to execute creation and redemption activity — even if they hadn’t been active in the fund previously.

Figure 1: APs for U.S.-domiciled ETFs³

Bar chart showing the total amount of contracted and active APs for U.S.-listed ETFs.

Chart description: Bar chart showing the total amount of contracted and active APs for U.S.-listed ETFs, along with the average contracted and active APs per ETF, over the reporting period of March 1, 2022 through February 28, 2023.


SIZE MATTERS

Because larger funds — those with more assets under management (AUM) — typically have higher trading volumes, they tend to be supported by a greater number of APs than funds with smaller AUM (Figure 2).
In fact, it is not uncommon for small funds to have limited or no primary market activity.

There were no creations or redemptions over the reporting period in nearly 3% of funds with $50 million or less in assets.4

Generally, increased trading volumes result in a higher number of active APs.

For example, funds that had an average daily volume (ADV) of $100 million or more had an average of 11 active APs over the reporting period, while funds with an ADV of $2 million or less had an average of four active APs (Figure 3).5

Figure 2: Max and average active APs by ETF AUM⁶

Bar chart showing the maximum, and average, amount of active APs per U.S.-listed ETF by assets under management.

Chart description: Bar chart showing the maximum, and average, amount of active APs per U.S.-listed ETF by assets under management over the reporting period of March 1, 2022 through February 28, 2023.


Figure 3: Max and average active APs by ETF ADV⁷

Bar chart showing the maximum, and average, amount of active APs per U.S.-listed ETF by average daily volume.

Chart description: Bar chart showing the maximum, and average, amount of active APs per U.S.-listed ETF by average daily volume (a measure of trading) over the reporting period of March 1, 2022 through February 28, 2023.


PARTICIPATION

Some asset classes require specialized infrastructure and/or expertise, which may result in fewer APs that are equipped to support these funds (Figure 4).

Figure 4: Max and average active APs by asset class⁸

Bar chart showing the maximum, and average, amount of active APs per U.S.-listed ETF by asset class.

Chart description: Bar chart showing the maximum, and average, amount of active APs per U.S.-listed ETF by asset class over the reporting period of March 1, 2022 through February 28, 2023. 


Still, there’s a robust group of APs at the ready even in these more complex products (Figure 5).

Figure 5: Max and average active APs for fixed income ETFs⁹

Bar chart showing the maximum, and average, amount of active APs per U.S.-listed ETF by fixed income sub-asset class.

Chart description: Bar chart showing the maximum, and average, amount of active APs per U.S.-listed ETF by fixed income sub-asset class over the reporting period of March 1, 2022 through February 28, 2023.


ENGAGEMENT

Even smaller ETF issuers by AUM utilize the breadth of the ETF marketplace and engage with multiple APs (Figure 6).

Figure 6: Sample APs by ETF issuer¹⁰

Bar chart showing the total amount of active, and contracted, APs per U.S.-listed ETF issuer along with the corresponding assets under management.

Chart description: Bar chart showing the total amount of active, and contracted, APs per U.S.-listed ETF issuer along with the corresponding assets under management over the reporting period of March 1, 2022 through February 28, 2023.


APs capitalize on the wide range of ETF offerings. The top APs have contracts for over 1,700 ETFs each and actively engage with anywhere between 200 and 2,100 ETFs (Figure 7).

Figure 7: U.S. ETF ticker coverage for the top ten APs¹¹

Bar chart showing the total amount of U.S.-listed ETF tickers where the largest APs are contracted or active.

Chart description: Bar chart showing the total amount of U.S.-listed ETF tickers where the largest APs are contracted or active over the reporting period of March 1, 2022 through February 28, 2023. 


A DIVERSE PLAYING FIELD

Total creation and redemption activity is spread across dozens of APs. In all, 39 APs created and redeemed shares over the reporting period.12

The AP with the highest percentage of activity, Bank of America (BofA), accounted for less than one-quarter of all ETF creations and redemptions by dollar value (Figure 8).

Figure 8: Gross creation and redemption activity by AP¹³

Pie chart showing the breakdown of gross creation and redemption activity by AP, for U.S.-listed ETFs.

Chart description: Pie chart showing the breakdown of gross creation and redemption activity by AP, for U.S.-listed ETFs over the reporting period of March 1, 2022 through February 28, 2023.


THE REAL ACTIVITY IS ON-EXCHANGE

APs are key contributors to smooth ETF operations, but they are responsible for only a small percentage of ETF activity.

The ratio of secondary market activity to primary market activity is 6:1. This means that for every $6 of trading that takes place between investors on exchange, only $1 flows through into the primary market (Figure 9).14

Figure 9: Industry primary and secondary market activity¹⁵

Bar chart comparing the total amount of gross primary market activity with secondary market activity for U.S.-listed ETFs.

Chart description: Bar chart comparing the total amount of gross primary market activity with secondary market activity for U.S.-listed ETFs over the reporting period of March 1, 2022 through February 28, 2023. 


2022 VS 2021: WHAT'S CHANGED?

N-CEN data provides insight into the breadth of the AP ecosystem and how it has changed over time. When comparing 2022 N-CEN data to 2021 numbers, there are some notable takeaways:

  • Primary market volumes have grown. APs facilitated $6.7 trillion in primary market activity — a 12% increase from 2021. Despite the increase in flows, APs continued to efficiently support primary market trading.16
  • ETF primary market activity is spread across a diverse group of APs. For example, APs who have historically been less active in ETF primary markets accounted for a greater share of creation/redemption activity in 2022, particularly in US Treasuries, highlighting the breadth of support for ETFs.17
  • AP participation is growing in active ETFs. In line with the growth of active ETFs (by AUM and number of funds) year over year, the number of APs supporting these products has also increased. Of 39 active APs, 27 facilitated creations and redemptions in actively managed ETFs—up from 23 APs in 2021.18

THE BOTTOM LINE

ETF creations and redemptions are spread over a large and diverse base of APs which has grown since every year since the N-CEN data was first published. Reviewing N-CEN data over time shows that the AP universe is diverse and efficiently supports ETF primary market activity even in times of market stress. Overall, this broad and dynamic engagement by APs supports a healthy ETF ecosystem and allows for support of both new and existing products.

CASE STUDY: THE ROLE OF APs IN DELIVERING iSHARES ETF MARKET QUALITY

How APs support market quality of iShares ETFs

Market quality reflects an ETF’s ability to offer liquidity, price discovery and efficient access to markets in all market conditions. Even though most ETF trading occurs in the secondary market, efficient primary market operations are at the heart of ETF market quality. Because primary market efficiency requires a functioning arbitrage mechanism to help keep the price of an ETF in line with the value of its underlying securities, an ETF’s primary market efficiency typically relies on market participation. For example, an ETF that interacts with a diverse set of APs will have a more competitive market. More market participant involvement can provide additional support for the ETF’s primary market operations.

U.S. iShares ETFs had an average of 43 contracted and six active APs per ETF in 2022, compared to the industry average of 24 contracted and five active APs per ETF.19 Roughly $1.5 trillion in primary market activity in U.S. iShares ETFs was distributed across APs (Figure 10).

Figure 10: U.S. iShares ETF gross creation and redemption activity by AP²⁰

Pie chart showing the breakdown of gross primary market activity by AP for iShares U.S-listed ETFs.

Chart description: Pie chart showing the breakdown of gross primary market activity by AP for iShares U.S-listed ETFs over the reporting period of March 1, 2022 through February 28, 2023. 


U.S.-listed US Treasury iShares ETFs saw the greatest increase in gross primary market activity year-over-year, while flows were relatively stable across the other sub-asset classes (Figure 11).

Figure 11: U.S. iShares ETF gross primary market activity by sub-asset class ($ billions)²¹

Bar chart showing the amount of gross primary market activity by sub-asset class for iShares U.S.-listed ETFs.

Chart description: Bar chart showing the amount of gross primary market activity by sub-asset class for iShares U.S.-listed ETFs over the reporting period of March 1, 2022 through February 28, 2023.


AP PARTICIPATION IN iSHARES ETFs

As ETFs have evolved to provide investors access to a variety of asset classes, sectors and geographies, so too have APs’ businesses to support these products. Even ETFs offering specialized strategies, like iShares small cap equity and fixed income ETFs, are supported by multiple APs (Figure 12).

Figure 12: U.S. iShares ETFs max and average active APs by asset class, market, and size²²

Bar chart showing the maximum, and average, amount of active APs per iShares U.S.-listed ETF by asset class, market, and size.

Chart description: Bar chart showing the maximum, and average, amount of active APs per iShares U.S.-listed ETF by asset class, market, and size over the reporting period of March 1, 2022 through February 28, 2023.


Out of the 381 U.S. iShares ETFs analyzed, 230 (60%) had five or more active APs in 2022, while 47 (12%) had two or less active APs. Of those, just 21 (9%) had one active AP in 2022.23

There are several reasons why a fund may have a small number of active APs. One example is the maturity of the fund. It may take time for an ETF to gather assets; lower flows in the early stages of an ETF’s lifecycle may offer less of an economic incentive for multiple APs to create or redeem shares. The type of strategy an ETF pursues can also impact the number of APs that create or redeem shares. Some strategies may require more specialized expertise that not all APs are able to offer.

Of the 47 U.S. iShares ETFs with two or less active APs in 2022, 43% were launched within the last two years.24 Relatedly, the average AUM for U.S. iShares ETFs with two or less active APs in 2022 was $88 million. Compare this to the average AUM of U.S. iShares ETFs with five or more active APs in 2022, which was nearly $9.0 billion.25 The majority of iShares U.S. ETF assets (by AUM and number of funds) are supported by five or more active APs (Figure 13).

Importantly, primary market efficiency is not solely determined by the number of APs supporting an ETF. For example, ETFs backed by platforms that leverage technology and scale are more likely to efficiently process ETF primary market activity.

Figure 13: Distribution of U.S. iShares ETF AUM and number of ETFs by average active APs²⁶

Bar chart showing the sum of AUM and number of ETFs for iShares U.S.-listed ETFs by the number of active APs.

Chart description: Bar chart showing the sum of AUM and number of ETFs for iShares U.S.-listed ETFs by the number of active APs over the reporting period of March 1, 2022 through February 28, 2023.


Important notes:

Data in this paper, unless otherwise noted, was compiled using Form N-CEN disclosures, publicly available at https://www.sec.gov/edgar.shtml. Additional information on Form N-CEN is available at https://www.sec.gov/files/formn-cen.pdf

Only funds subject to the Investment Company Act of 1940 are required to file Form N-CEN disclosures. As of June 30, 2023, ETFs representing 97% of eligible ETF AUM have filed Form N-CEN.

Funds captured in this analysis must have: a) filed a Form N-CEN prior to June 30, 2023 and b) still been active (i.e., had not been liquidated or delisted) as of February 28, 2023.

Form N-CEN filings may have different reporting periods based on the reporting fund’s fiscal year-end or legal structure.

Form N-CEN data in this paper covers forms with report ending periods from March 1, 2022 to February 28, 2023.

All reporting ETFs were aggregated to the issuer’s parent company.

Authorized participant filing names were aggregated under the institution’s primary legal entity.

Gross notional value was calculated by summing the reported “Authorized Participant Purchase Value” and “Authorized Participant Redeem Value” fields of Form N-CEN.

Markit and Morningstar data was used for asset class categorization.

Samara Cohen

Samara Cohen

Managing Director, Chief Investment Officer of ETF and Index Investments

Samantha Merwin, CFA

Head of BGM Advocacy

Contributor

Alec Woodworth, CFA

BGM Advocacy

Contributor