Flow & Tell with iShares | March 2023

MARCH MADNESS FOR ETFs AS FLOWS BOUNCE BACK

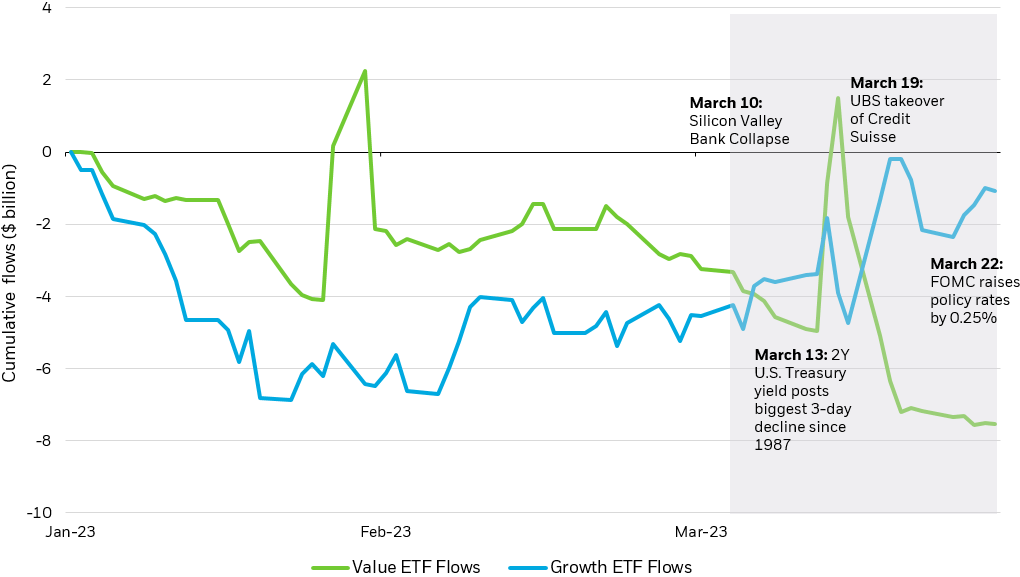
Trading volumes spiked in March on the heels of bank tumult in the U.S. and across the pond. Investors navigated extreme price action in both bond and stock markets as March registered some notable milestones: the 2-year U.S. Treasury yield experienced its largest one-day decline1, interest rate volatility reached its Global Financial Crisis level, and all four number one-seeds in the March Madness tournament were eliminated before the Elite Eight.

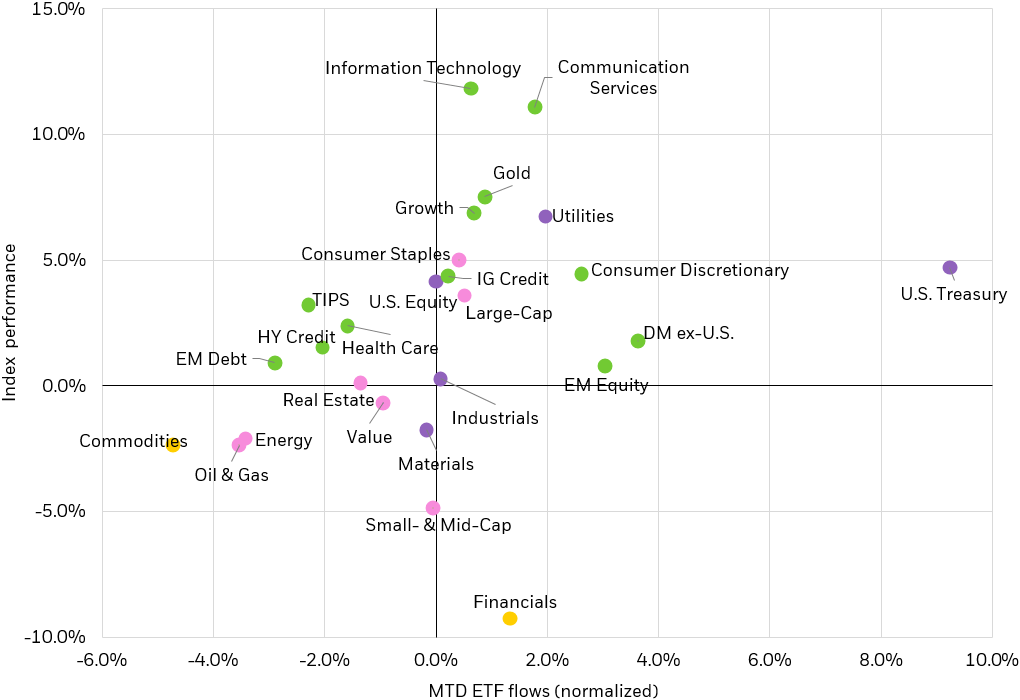
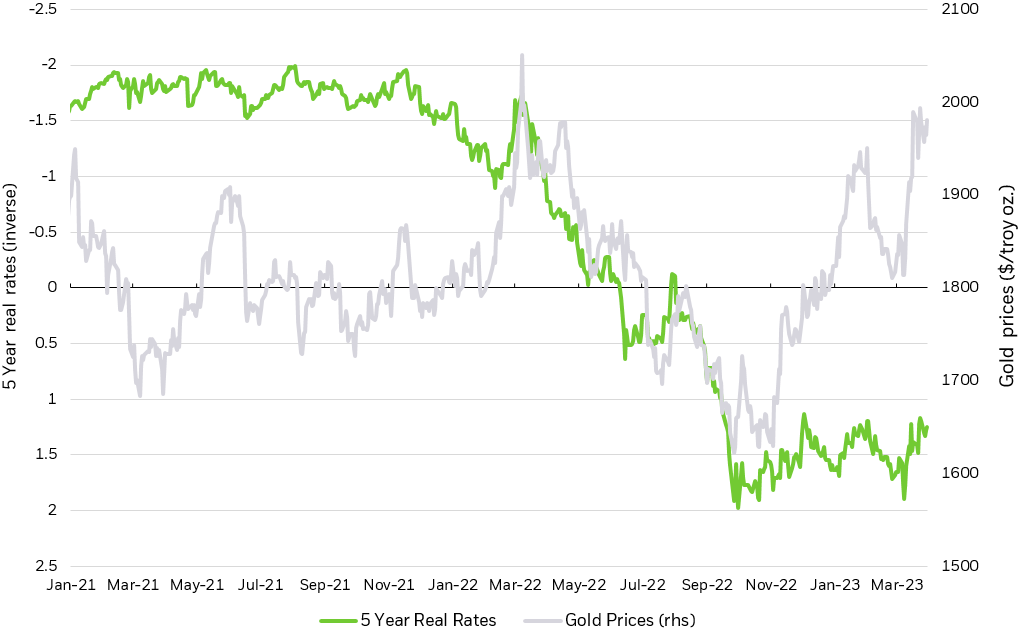
Bank sector volatility sent investors dashing to cash, and money market funds and short-dated Treasuries collected near-record inflows. The month’s FOMC meeting reset rate expectations, and growth equity ETFs emerged as popular exposures as the rate tightening campaign nears its end. Finally, investors turned to gold as a relative “safe-haven” allocation during March’s heightened volatility.

THEMES OF THE MONTH

Stress relief

Banking sector anxiety prompted investors to increase the credit quality of their bond portfolios.

Growth spurt

Equities adjust to lowered terminal rate expectations on the heels of March’s FOMC meeting, and flows rotate from value to growth exposures in tandem.

Golden i(Shares)

Investors add to gold, upping portfolio diversification amid heightened volatility.

MARCH ETF FLOWS

March ETF heat map

March ETF flows compared with index performance

Scatter plot showing the relationship between index performance and ETF sub-asset class flows for March 2023.

Source: BlackRock, Bloomberg, chart by iShares Investment Strategy. As of March 31, 2023. Flows normalized by AUM as of February 28, 2023.


Index performance is for illustrative purposes only. Index performance does not reflect any management fees, transaction costs or expenses. Indexes are unmanaged and one cannot invest directly in an index. Past performance does not guarantee future results.


Index performance is measured by the following indexes: EM Equity: MSCI Emerging Markets IMI Index; Gold: ICE LBMA Gold Price Index; U.S. Treasury: ICE BofA 10-Year U.S. Treasury Index; Communication Services: S&P 500 GICS Level 1 Communication Services Sector Index; Utilities: S&P 500 GICS Level 1 Utilities Sector Index; HY Credit: iBoxx USD High Yield Index; Commodities: S&P GSCI Index; Information Technology: S&P 500 GICS Level 1 Information Technology Sector Index; Consumer Staples: S&P 500 GICS Level 1 Consumer Staples Sector Index; health Care: S&P 500 GICS Level 1 Health Care Sector Index; Financials: S&P 500 GICS Level 1 Financials Sector Index; Industrials: S&P 500 GICS Level 1 Industrials Sectors Index; Energy: S&P 500 GICS Level 1 Energy Sectors Index. Coloring is based on quadrants: quadrant I: green; quadrant II: yellow; quadrant III: pink; quadrant IV: purple.

Chart description: Scatter plot showing the relationship between index performance and ETF sub-asset class flows for March 2023. Chart shows some sectors, like Energy and Commodities, see both negative index performance and outflows in March. On other hand, DM ex-U.S. Equities and Consumer Discretionary sectors saw both positive ETF flows and index performance.


STRESS RELIEF

In March, markets grappled with regional bank failures, mixed economic data, and undeterred central banks that continued to hike rates. These developments triggered big shifts in global yield curves and the highest level of bond market volatility since the Global Financial Crisis.2

Amid this uncertainty, investors used ETFs to quickly adjust their allocations, with a clear preference for higher quality bonds. Top-rated U.S. Treasury ETFs added more than $24 billion — setting a record for monthly flows — while credit-risky corporate and high yield bond ETFs suffered redemptions.

Within the U.S. Treasury category, two themes are evident. First, ETFs focused on T-bills and other short term government bonds were popular choices, presumably acting as a landing spot for assets leaving bank deposits. While these ETFs do not feature FDIC guarantees like other savings vehicles, they may provide additional income. As an example, SGOV (iShares 0-3 Month Treasury Bond ETF) posted its largest monthly inflow on record ($2.2 billion) as investors targeted attractive yields at the front end of the curve.

At the same time, the Treasury ETF flows data also shows an appetite for longer maturity exposures. Those bonds are traditionally associated with a “flight to quality” trade and generally outperformed their shorter-term counterparts in March as rates declined in March. IEF (iShares 7-10 Year Treasury Bond ETF) was the top asset gathering bond ETF in March, adding $6 billion. Its longer duration cousin TLT (iShares 20+ Year Treasury Bond ETF) was also among the top recipients as investors rushed to build potential recession hedges into their portfolios.

ETF investors rotate from credit to Treasury exposures

Bar chart depicting fixed income ETF flows, split by credit and government allocations dating from March 2020 to March 2023.

Source: BlackRock, Bloomberg, Markit, chart by iShares Investment Strategy. ETF groupings determined by BlackRock, Markit. As of March 30, 2023.

Chart description: Bar chart depicting fixed income ETF flows, split by credit and government allocations dating from March 2020 to March 2023. Additionally, the chart contains a line that displays the spread between credit yields and government yields, which steadily increases in March. The chart depicts an outflow of credit exposures in March, while inflow to government exposures.


GROWTH SPURT

March’s FOMC meeting coupled a 0.25% hike with a dovish message on growth, inflation, and unemployment — a marriage that brought a ceiling in sight for federal funds rates. Investment allocations diverged on this new rate expectation: one camp traded on soft landing expectations, while recession-wary bears turned defensive.

Notably, some investors who believe the Fed will engineer a soft landing flocked to growth as favored allocations, many of which were funded by an exodus from value exposures. Historically, growth equities have fared better as interest rates fall, as looser monetary policy provides cheaper sources for funding future growth. Value-style exposures, on the other hand, can struggle and relatively underperform when rates decline. March’s rate reset pushed cumulative growth net inflows into positive territory on the year, as U.S.-listed growth ETFs began March with net outflows of $4.3 billion but reversed to close the month.

While the higher-for-longer trade fell out of favor over the month, we remain focused on still-sticky inflation. Many investors who maintain conviction in the elevated rate regime, as well as those bracing for recession, turned to quality factor ETFs. Quality ETFs netted $13 billion of net inflows YTD, as their defensive fundamentals (low financial leverage, stable year-over-year earnings) attracted investors concerned about the macroeconomic uncertainty ahead.

Flows to growth ETFs increase on March’s heightened volatility

Area chart depicting ETF flows into growth and quality factor ETFs YTD, as well as the market-implied June policy rate.

Source: BlackRock, Bloomberg, Markit, chart by iShares Investment Strategy. Flows rebased to 0 as of January 01, 2023. ETF groupings determined by Markit.


Past performance does not guarantee future results.

Chart Description: Line chart depicting ETF flows into growth and value factor ETFs YTD, as well as different market impacts (bank stress, yield volatility, and policy rates). The chart shows growth ETF flows increasing as volatility picks up.


GOLDEN i(SHARES)

As a non-producing asset, there is often a tradeoff between gold and interest rates. As rates rose dramatically in 2022, and real rates turned positive very quickly, gold looked relatively less attractive as a store of value compared to high-quality fixed income, which offered both a flight to safety and attractive yields. However, as the Federal Reserve nears the end of their rate-hiking cycle, gold prices may have found support in the stabilization of real rates and a potential peak in the U.S. dollar.

March brought a slew of conditions usually favorable to gold. Investor fear skyrocketed, as bank failures captured headlines. Correlations between traditional asset classes like stocks and bonds turned positive, meaning investors had little place to hide. It’s no surprise, then, that investors turned to gold as a relative ‘safe-haven’ and an important source of diversification during a period of unusually volatility: over $800 million flowed into gold ETFs since the beginning of March.

Sentiment Reversal: Gold prices spike as real rates decrease

Line chart showing gold prices and 5 year real rates, dated from January 2021 to March 2023.

Source: BlackRock, Bloomberg. As of March 31, 2023. Chart by iShares Investment Strategy. Reference index is the LBMA Gold Price Index.


Index performance is for illustrative purposes only. Index performance does not reflect any management fees, transaction costs or expenses. Indexes are unmanaged and one cannot invest directly in an index. Past performance does not guarantee future results.

Chart description: Line chart showing gold prices and 5 year real rates, dated from January 2021 to March 2023. The chart shows an inverse relationship, and depicts gold prices rising in March, as real rates declines from last year’s highs.


FEATURED FUNDS

FEATURED FUNDS

FEATURED FUNDS

The iShares Gold Trust and iShares Gold Trust Micro are not an investment company registered under the Investment Company Act of 1940, and therefore are not subject to the same regulatory requirements as mutual funds or ETFs registered under the Investment Company Act of 1940. Investments in these ETF's are speculative and involves a high degree of risk. Visit www.iShares.com for a prospectus, which includes investment objectives, risks, fees, expenses, and other information that you should read and consider carefully before Investing.
Kristy Akullian, CFA

Kristy Akullian

Senior member of the iShares Investment Strategy team

Nick Morales

Investment Strategy

Contributor

Robert Young

Markets Coverage

Contributor

Tom Fickinger, CFA

Fixed Income Strategy

Contributor