- The likely end of the Fed’s hiking cycle creates expanded opportunities in fixed income.
- Targeting ‘plus’ sectors — those outside traditional core bond allocations — presents potential opportunity for higher yield and diversification away from major fixed income sectors.
- Active management may be a useful solution for investors seeking to target the ‘plus’ sectors of the market while helping to manage both interest rate volatility and credit risk.
- The BlackRock Flexible Income ETF (BINC) can help investors access hard-to-reach segments of the fixed income market, with the convenience of an ETF.
Seeking higher income with BlackRock’s Rick Rieder
Mar 13, 2024 Fixed Income
KEY TAKEAWAYS
BlackRock recently introduced the BlackRock Flexible Income ETF (BINC), which seeks to offer investors access to harder-to-reach fixed income sectors. The exchange traded fund (ETF) is managed by an experienced team led by Rick Rieder, BlackRock’s Chief Investment Officer of Global Fixed Income, and winner of Morningstar’s 2023 Outstanding Portfolio Manager award.1
Karen Veraa, Head of iShares U.S. Fixed Income Strategy, recently sat down with Rick to discuss his outlook for fixed-income investing.
FIXED INCOME OPPORTUNITIES
Karen Veraa:
Rick, what do you think of the opportunity in fixed income markets this year?
Rick Rieder:
I think the opportunity is still attractive. The Fed is most likely done with its hiking cycle and while a lot of money went to cash in 2023 — $1.2 trillion2 — we believe this is a year for putting some money to work in the bond market. We think the Fed will hold rates at current levels and look to move towards cutting in the second half of the year, or springtime at the earliest. Historically, that period between the end of the hiking cycle and the beginning of cuts has been a great time to make money in fixed income (see Figure 1).
In the last five hiking cycles going back to 1990, both stocks and bonds handily outperformed cash during the pause period between the last Fed rate hike and the central bank’s first cut. However, the difference between bonds and cash has been greater during the pause than after the first cut.
Figure 1: Average returns between last hike and first pause
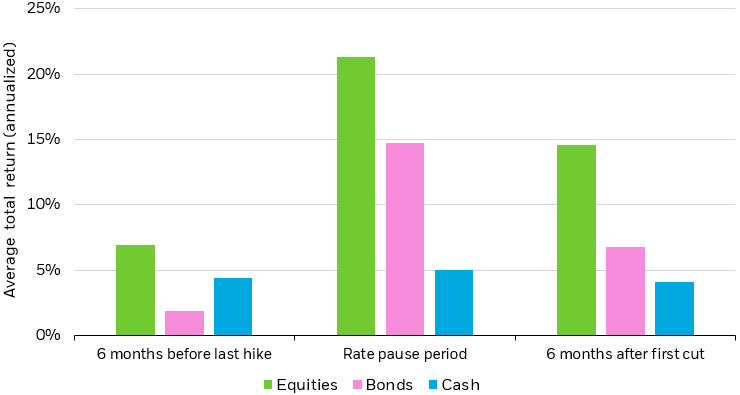
Source: Bloomberg, as of November 16, 2023. Total return analysis produced by iShares Investment Strategy. Historical analysis calculates average performance of the S&P 500 index (equities), the Bloomberg U.S. Aggregate Bond Index (bonds), and the Bloomberg U.S. Treasury Bills: 1-3 Months TR Index (cash) in the 6 months leading up to the last Fed rate hike, between the last rate hike and first cut, and the 6 months after the first cut. The dates used for the last rate hike of a cycle are: 2/ 1/1995, 3/25/1997, 5/16/2000, 6/29/2006, 12/19/2018. Dates used for the first rate cut are: 7/6/1995, 9/29/1998, 1/3/2001, 9/18/2007, 8/1/2019. Index performance is for illustrative purposes only. Index performance does not reflect any management fees, transaction costs or expenses. Indexes are unmanaged and one cannot invest directly in an index. Past performance does not guarantee future results.
Chart description: Bar chart showing a average return comparison of stocks, bonds and cash over three time periods from 1995 to 2018: 6 months before the Fed’s last rate hike, during the ‘pause period’ between the last rate hike and first cut, and 6 months after the first cut. In each timeframe, cash underperformed both stocks and bonds.
We saw some expectation of that “pause period” rally reflected in price action in the last couple of months of last year, but still remain excited about the opportunity in fixed income.
We have anchored our portfolios with high-quality, short-duration fixed income securities, but we are increasingly comfortable taking on intermediate-term duration risk. In addition, we have been taking on some credit risk in our portfolios.3
INCREASE IN YIELDS
Karen Veraa:
If the yields on safer assets have moved higher, should investors even be considering riskier assets?
Rick Rieder:
You’re right, with the risk-free rate a lot higher, you can potentially earn healthy levels of yield around 4% to 5% in less risky assets like US Treasuries, Agency Mortgage-Backed Securities and US investment grade corporate bonds.4 These are the kinds of assets that make up traditional ‘core’ bond allocations in investors’ portfolios and historically have provided ballast to the equity allocations in portfolios.
However, if you’re a fixed income investor with a higher income target — or are not sure about taking on longer duration exposures — you may want to consider the attractive yields we've seen further out the risk spectrum. We sometimes refer to these sectors as the ‘plus’ sectors — where you’re going beyond your traditional core bond allocations in search of yield opportunity and potential diversification.
For example, U.S. AAA-rated collateralized loan obligations (CLOs) have shown a yield of 5.88% with minimal interest rate risk because they are floating rate instruments.5 Notably, AAA-rated CLOs have never defaulted — even in 2008-2009 during the Great Financial Crisis.6
We also like:
- Non-U.S. credit, especially investment grade. We can hedge back the currency risk and potentially add 1.48% of yield for the same type of risk relative to the U.S.7
- Going further down in credit quality, you can look to do the same thing in European high yield for near double-digit yields. Segments of U.S. high yield debt also look attractive.
- With inflation and growth decelerating globally, we have added some duration in Europe and believe parts of local currency emerging market (EM) debt are also attractive due to high real rates in some of those countries. For instance, Mexico really pops out when you consider global trends and the level of real rates there.8
These are segments of the market still yielding above 7%. If you approach them the right way and manage your risk appropriately, you can build a high-income portfolio that’s well diversified across these sources of return. (see Figure 2.)
Figure 2: Yield levels across key ‘Plus’ sectors have risen from 2021 to 2024
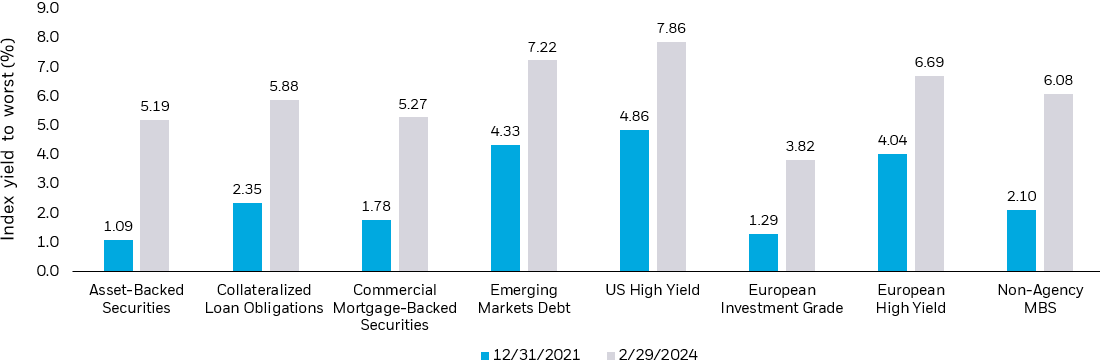
Source: BlackRock, as of February 29, 2024. Asset-Backed Securities yield represented by Bloomberg ABS — Aaa Auto and Credit Card Index, Collateralized Loan Obligations represented by JP Morgan CLOIE AAA Index, Commercial Mortgage-Backed Securities represented by Bloomberg US CMBS Investment Grade: AAA Index, Emerging Markets represented by Bloomberg EM USD Aggregate Index, US High Yield represented by Bloomberg US Corporate High Yield Index, European Investment Grade represented by Bloomberg Euro Aggregate Corporate Index, European High Yield represented by Bloomberg Pan-European High Yield Index, and Non-Agency Mortgage-Backed Securities represented by Bloomberg Non-Agency CMBS Agg Eligible Index. Index performance is for illustrative purposes only. Index performance does not reflect any management fees, transaction costs or expenses. Indexes are unmanaged and one cannot invest directly in an index. Past performance does not guarantee future results.
Chart description: Bar chart comparing current yields on so-called plus sectors of fixed income vs the yields on similar assets at the end of 2021. The plus sectors are Asset-Backed Securities, Collateralized Loan Obligations, Commercial Mortgage-Backed Securities (U.S.), Emerging Markets Debt, U.S. High Yield, European Investment Grade and High Yield credit, and Non-Agency U.S. MBS. For each sector, yields are higher today vs. the end of 2021.
EASY ACCESS
Karen Veraa:
I often get feedback from investors that they would like to invest in these areas but find it hard to size and / or time positions. Is this why BINC was created?
Rick Rieder:
Absolutely. It comes down to access. We wanted to build a product to give investors the chance to access hard-to-reach segments of the fixed income market, with the easy access of investing in an ETF. Take emerging markets debt as an example. The EM debt universe is made up of dozens of countries, thousands of US dollar- and local currency-denominated bonds, and both sovereign and corporate bonds in the mix. Managing all those idiosyncratic risks — macro risks, foreign exchange risks and credit risk — while being able to take a high conviction view is challenging.
We believe that our global investment platform, which takes both ‘top down’ macro views and incorporates ‘bottom up’ security level research, can be of benefit to clients looking to access this space. There are certainly some great EM debt index ETFs out there, but we believe our EM team can generate alpha relative to traditional EM indices and that this is an area where we can continue to add additional value through active management.
Similarly, high yield is a segment of the market that can show a high level of dispersion, meaning a wide range of returns among individual bonds. We believe our Fundamental Fixed Income team can take advantage of this dispersion and seek to generate alpha (meaning performance above index/market returns) over time.
This is hard stuff and takes a large, global team to do. This is why we have both index and active at BlackRock. We recognize this isn’t easy for our clients and the choice is important.
Karen Veraa:
EM and high yield debt are just two of the many sectors that make up BINC. BINC is by definition a plus sector product because we have put a 20% limit on how much of the traditional core sectors it can hold (see Figure 3). BINC has a duration band of 1 to +5 years and a limit of 15% to CLOs.
VALUE ABOVE BENCHMARKS
Apart from that, the fund takes a very diversified approach to how it targets yield and allocates across different sectors. It’s early days but we’re proud of the way the product has performed so far — as of February 29, 2024, it has outperformed its reference benchmark (the Bloomberg Universal Index) by 4.85% since inception, and is in the top quartile of its Morningstar peer group — the Multisector Bond category.9 Also since inception, BINC has averaged a high level of yield with a lot less volatility compared to the Bloomberg U.S. High Yield BB Corporate Bond Index (see Figure 3). We see BINC as a great complement to a traditional core bond allocation, which you can buy more or less of based on your risk appetite.
Figure 3: Seeking to maximize income across markets
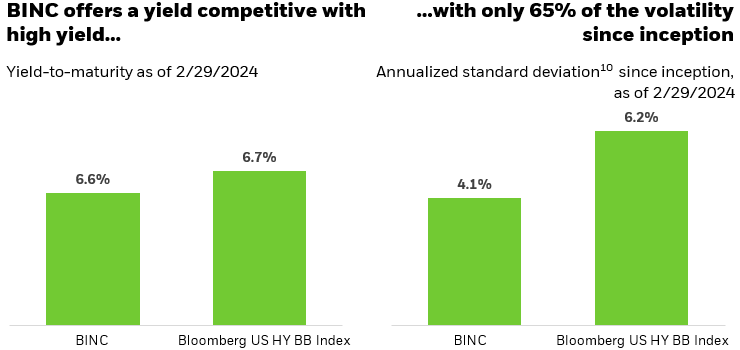
Source: Bloomberg, BlackRock, as of 2/29/2024. High Yield represented by the Bloomberg US High Yield BB Index. BINC was incepted on 5/19/2023. Standard deviation11 based on weekly returns. Performance data represents past performance and does not guarantee future results. Investment return and principal value will fluctuate with market conditions and may be lower or higher when you sell your shares. Current performance may differ from the performance shown. For most recent month-end performance see www.iShares.com. For standardized performance and the 30-day SEC yield, see the end of this document. Index performance is for illustrative purposes only. Index performance does not reflect any management fees, transaction costs or expenses. Indexes are unmanaged and one cannot invest directly in an index.
Chart description: Bar chart showing how the BlackRock Flexible Income ETF (BINC) has both a higher yield-to-maturity vs. the Bloomberg U.S. High Yield BB Index as well as lower volatility than the index since BINC’s inception on May 19, 2023.
Karen:
Last question Rick. At BlackRock we’ve been managing active fixed income ETFs for over a decade, but it seems like the interest in them has spiked in the past couple of years. Do you think active ETFs have more of a role to play in investors’ portfolios?
Rick:
We’ve been really pleased by the uptake of BINC since its launch last May. Assets have risen to over $1.6 billion11 and I have a lot of investors telling me this is the kind of income seeking solution they’ve been looking for. To answer your question more broadly, I do think active ETFs are going to play more of a role going forward. Investors can anchor their portfolios with low cost, efficient, index-tracking ETFs and then partner them with active mutual funds or active ETFs like BINC that seek to add value above broad benchmarks. It’s a great time to be in the portfolio construction game, Karen!
THE BLACKROCK FLEXIBLE INCOME ETF FOCUSES ON ‘PLUS SECTORS’
The elements of our ongoing portfolio evaluation.
Sector allocation
Active rotation across income-producing sectors
Security selection
Strong bottom-up research dedicated to identifying well supported credits
Duration, yield curve, macro
Manage positioning across duration, yield curve and broad risk
| Primary “Plus” Sectors | Complementary Sectors |
|---|---|
| • Asset-backed securities (ABS) | • US Treasuries |
| • Bank Loans | • US Treasury Inflation Protected Securities (TIPS) |
| • Collateralized Loan Obligations (CLOs) | • US Agencies |
| • Commercial Mortgage-Backed Securities (CMBS) | • US Mortgages |
| • Emerging Markets | • US Municipals |
| • High Yield Corporates | • Investment Grade Corporates |
| • Non-US Credit | • Global Developed Market Sovereigns |
| • Non-Agency Residential Mortgage-Backed Securities (RMBS) | • Global Inflation—Linked Bonds |
Source: BlackRock, as of 1/30/2024.
| 1-Year Returns | 5-Year Returns | 10-Year Returns | Since Inception | |||||||||
|---|---|---|---|---|---|---|---|---|---|---|---|---|
| Fund Name Fees as of current prospectus. All other data as of 12/29/2023 | Fund Inception Date | Expense Ratio (Net / Gross) | 30-Day SEC Yield (With / without waiver) | Contractual Fee Waiver Expiration (If Applicable) | NAV | Mkt Price | NAV | Mkt Price | NAV | Mkt Price | NAV | Mkt Price |
| BlackRock Flexible Income ETF | May 19, 2023 | 0.4% / 0.53% | 5.62% / 5.50% | June 30, 2025 | -- | -- | -- | -- | -- | -- | 7.41% | 7.95% |
BlackRock Fund Advisors, the investment adviser to the Fund and an affiliate of BlackRock Investments, LLC, has contractually agreed to waive a portion of its management fees through Jun 30, 2025. Please see the Fund’s prospectus for additional details.
The performance quoted represents past performance and is no guarantee of future results. Investment returns and principal values may fluctuate so that an investor’s shares, when redeemed, may be worth more or less than their original cost. All returns assume investment of dividends and capital gains. Current performance may be lower or higher than that shown. Investment returns reflect total fund operating expenses, net of all fees, waivers and/or expense reimbursements. Refer to blackrock.com for current month end performance.
Shares of ETFs are bought and sold at market price (not NAV) and are not individually redeemed from the fund. Any applicable brokerage commissions will reduce returns. Beginning August 10, 2020, market price returns for BlackRock and iShares ETFs are calculated using the closing price and account for distributions from the fund. Prior to August 10, 2020, market price returns for BlackRock and iShares ETFs were calculated using the midpoint price and accounted for distributions from the fund. The midpoint is the average of the bid/ask prices at 4:00 PM ET (when NAV is normally determined for most ETFs). The returns shown do not represent the returns you would receive if you traded shares at other times.

